Tampa 3Q23
Multifamily Market Report

$1,853

average rent

93.8%

average occupancy rate

$1.09B

ytd sales volume

-1.3%

YoY rent change

-1.2 POINTS

yoy occupancy change

32 YTD

individual transactions

Supply & Demand

3Q23

577 Units

QUARTERLY DEMAND
YTD: 1,717

1,456 Units

QUARTERLY COMPLETIONS
YTD: 4,756

Annual Demand vs Completions

2018
5,408
5,530
2019
4,991
5,554
2024
4,321
4,570
2021
11,605
6,200
2022
-1,025
7,794
2023 YTD
1,717
4,756
  • Planned
    Completions
  • Pre-Planned
    Demand

Demand Trends

  • With the conclusion of the third quarter of 2023, a clearer insight into Tampa’s multifamily market’s performance is emerging, following the significant fluctuations experienced over the last two and a half years. With a net total of 577 apartments newly leased in 3Q, demand was solid, albeit below the average of 1,200 units typically absorbed in the third quarter during the pre-pandemic era.

  • At a submarket level, positive net absorption was recorded in seven out of the 15 submarkets during the third quarter. The New Tampa / East Pasco County submarket stood out, accounting for the absorption of 516 units.

Completion Trends

  • During the third quarter of 2023, Tampa’s apartment inventory saw an increase of 1,456 units. The New Tampa / East Pasco County and Brandon / Southeast Hillsborough County submarkets were major contributors to this growth, adding 629 and 439 new units, respectively.

  • Several submarkets have seen a notable increase in new completions, with a significant share of the new supply over the past year primarily funneled into the Brandon / Southeast Hillsborough County and New Tampa / East Pasco County submarkets. Together, these areas accounted for about half of the total new supply.

Demand Outlook

  • The absorption forecast for the upcoming four quarters stands at 6,641 units, aligning with traditional absorption patterns. However, an expanding construction pipeline presents some immediate challenges for property owners and managers.

  • The New Tampa / East Pasco County submarket is poised to be a significant demand hub in the forthcoming four quarters. The anticipated annual demand in this submarket is projected to account for nearly 40% of the total demand for the upcoming year, topping the list among all submarkets. 

New Supply Outlook

  • The Tampa apartment market is poised for a significant influx with over 9,800 new units earmarked for introduction in the upcoming four quarters.

  • The New Tampa / East Pasco County and Brandon / Southeast Hillsborough County submarkets are anticipated to be central to this expansion, with a collective contribution of over 5,100 units projected in the forthcoming year.

Occupancy & Rent Trends

RENT VS OWN
MONTHLY PAYMENT

$3,130

Average Monthly Mortgage Payment

$1,853

Average Monthly Rent

Occupancy trends

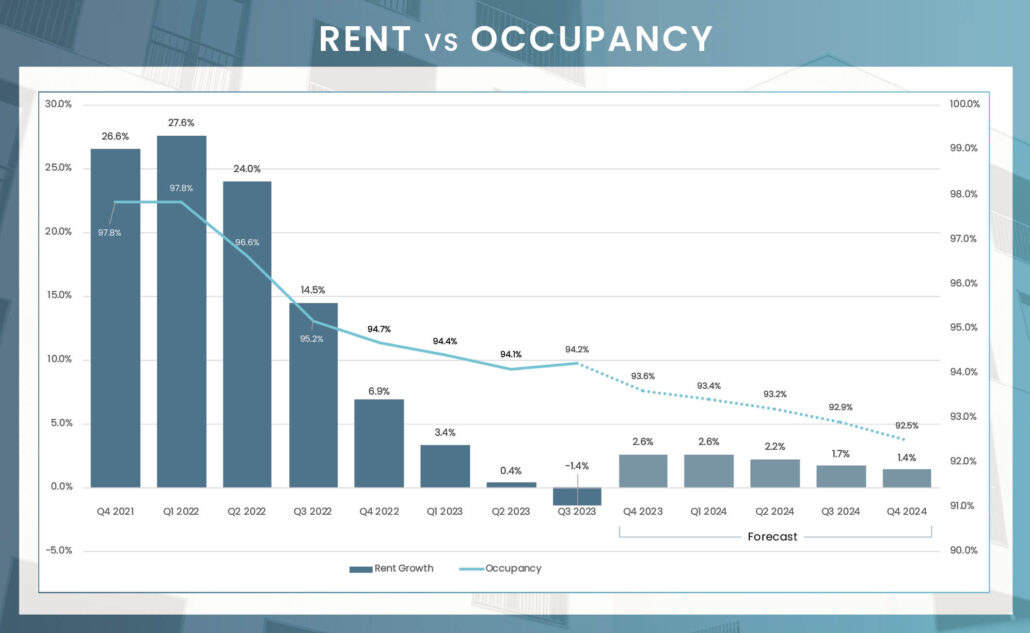
In the Tampa metropolitan area, the apartment market saw a year-over-year decrease of 120 basis points and a sequential quarter-over-quarter dip of 30 basis points in average occupancy, positioning the rate at 93.8%. Within the spectrum of property classes, both Class A and Class C units reached an occupancy level of 94.2%, while Class B units trailed slightly at 93.5%. Submarket occupancy levels varied modestly, ranging between 92.9% and 95.1%. The Largo / Seminole submarkets displayed the strongest occupancy in Q3 2023, in contrast to the softer figures in the Brandon / Southeast Hillsborough County submarket. Looking ahead, the Tampa apartment market is projected to maintain an occupancy rate around 92.9% over the next year. Despite potential challenges stemming from a burgeoning supply of new units, the market holds a firm foundation for a possible rebound.

RENTAL TRENDS

In line with a national moderation in apartment fundamentals, the Tampa-St. Petersburg market is experiencing a gentle easing of rent prices, diverging from the previous year’s peak increments. The third quarter of 2023 saw a modest year-over-year reduction in rents for new leases by 1.3%, a trend currently mirrored across various sunbelt markets. With an average monthly rent pegged at $1,853, Tampa positions itself as a more financially feasible option compared to South Florida, thereby enhancing Central Florida’s appeal for newcomers to the state.

Delving into different property classifications, Class A units have exhibited a stable trend with rent performance remaining positive over the past year at 0.7%. In contrast, Class C units followed with a modest 0.9% dip, while Class B units experienced a more noticeable annual rent decrease of 2.4%. Among the submarkets, Temple Terrace and University notably stood out, recording the most significant annual rent increases of 2.8% and 2.7%, respectively.

Submarket Rent & Occupancy

SubmarketAverage OccupancyAnnual Occupancy ChangeAverage Monthly RentAnnual Rent Change
Brandon/Southeast Hillsborough County92.9%-1.0%$1,779-4.5%
Carrollwood/Citrus Park93.5%-1.3%$1,775-2.8%
Central Tampa94.2%-0.8%$2,5761.1%
Clearwater93.8%-1.4%$1,779-2.3%
Egypt Lake/Lowry Park93.2%-1.5%$1,565-1.3%
Largo/Seminole95.1%-1.4%$1,7221.0%
New Tampa/East Pasco County93.6%-1.3%$1,831-3.7%
North Pinellas County94.8%-0.6%$1,797-2.7%
North St. Petersburg94.0%-1.1%$1,870-1.7%
Peninsula93.7%-0.4%$1,965-2.4%
South St. Petersburg94.1%-1.7%$2,0881.2%
Temple Terrace93.5%-2.7%$1,5672.7%
Town and Country/Westchase93.7%-0.7%$1,849-3.1%
University93.6%-1.0%$1,4882.8%
West Pasco County/Hernando County94.9%-1.5%$1,4970.9%
Tampa-St. Petersburg-Clearwater, FL93.8%-1.2%$1,853-1.3%

Units by Submarket Delivering in 2023

16,626

Units Under Construction

9,812

Units UC Delivering In the Next 4 Quarters

Number of Units Under Construction

Brandon/Southeast Hillsborough County - 2,990
0%
Carrollwood/Citrus Park - 234
0%
Central Tampa - 2,644
0%
Clearwater - 542
0%
Egypt Lake/Lowry Park - 245
0%
Largo/Seminole - 0
0%
New Tampa/East Pasco County - 4,321
0%
North Pinellas County - 0
0%
North St. Petersburg - 1,016
0%
Peninsula - 1,170
0%
South St. Petersburg - 1,888
0%
Temple Terrace - 0
0%
Town & Country/Westchase - 277
0%
University - 0
0%
West Pasco County/Hernando County - 1,299
0%

Number of Units Delivering Next 4Q

Brandon/Southeast Hillsborough County - 1,896
0%
Carrollwood/Cistrus Park - 0
0%
Central Tampa - 1,841
0%
Clearwater - 358
0%
Egypt Lake/Lowry Park - 0
0%
Largo/Seminole - 0
0%
New Tampa/East Pasco County - 2,911
0%
North Pinellas County - 0
0%
North St. Petersburg - 472
0%
Peninsula - 350
0%
South St. Petersburg - 971
0%
Temple Terrace - 0
0%
Town & Country/Westchase - 237
0%
University - 0
0%
West Pasco County.Hernando County - 776
0%

Sales Activity

The Tampa apartment market has seen a noticeable slowdown, a ripple effect of heightened interest rates. Although there’s been a decline in annual volume compared to 2022, the first three quarters of the current year still witnessed respectable transaction activity. According to data from Real Capital Analytics, the sales of single asset conventional multifamily properties in Tampa amounted to approximately $1.09 billion year to date.

*Most Active Buyers and Sellers are based on the sale volume of apartment units.
  1. Lurin Capital
  2. Ares Management
  3. Bell Partners
  4. TruAmerica Multifamily
  1. LIV Development
  2. Bromley Companies
  3. Crescent Communities
  4. Related Companies

TRANSACTION VOLUME


YTD Transaction Volume


Y-O-Y Change


Individual Transaction Count


Price Per Unit


Annual Price Change

* Trailing 4Q average PPU

* Preliminary Data from RCA – Individual transaction $2.5M +

Economy

In July 2023, the Tampa-St. Petersburg-Clearwater metro area experienced a net gain of 53,600 jobs from July 2022, representing a 3.7% increase in employment. As a result, the unemployment rate in rose by 20 basis points compared to the previous year, reaching 3.1%, which is significantly lower than the national benchmark of 3.8%. The education/health services industry saw the most significant job gains with 21,000 jobs added. Additionally, the professional and business services industry realized the significant expansion of 5.0% with 14,300 jobs added.

53.6K

May Annual Jobs Created

3.7%

May 23 Employment growth

3.1%

May 23 Unemployment rate
3.8% us may rate

Top 5 Employment Sector Annual Change

education & health services

education & health services

Change from May 2022 to May 2023:
21,000

Percent Change:
9.5%

professional & business services

professional & business services

Change from May 2022 to May 2023:
14,300

Percent Change:
5.0%

trade, transportation & utilities

trade, transportation & utilities

Change from May 2022 to May 2023:
6,000

Percent Change:
2.2%

construction

construction

Change from May 2022 to May 2023:
5,300

Percent Change:
5.9%

leisure & hospitality

leisure & hospitality

Change from May 2022 to May 2023:
4,000

Percent Change:
2.5%

Hover over icons to view data
Tap icons to view data
SectorChange from May 2022 to May 2023 Percent Change
Education and health services21,0009.50%
Professional and business services14,3005.00%
Trade, transportation, and utilities6,0002.20%
Construction5,3005.90%
Leisure and hospitality4,0002.50%
Other services2,6005.50%
Manufacturing2,4003.30%
Government2,1001.50%
Mining and logging00.00%
Information-500-1.70%
Financial activities-3,600-2.60%

Cost of Living Comparison

Tampa, FL, offers a more affordable living experience compared to Miami, with a Cost of Living Index of 95.1 and a Housing Index of 92.7. The median home sales price stands at $409,900, representing a year-over-year decrease of 0.3%. When compared to Miami, Tampa’s housing costs are 36.4% lower, and residents also enjoy lower costs in groceries (6.2% less), utilities (6.0% less), transportation (4.5% less), and healthcare (2.4% less). The average mortgage payment in Tampa is estimated at $3,130, while the average rent is around $1,853, showcasing the city’s affordability in both the rental and buyer’s market.

Miami, FL vs. Tampa, FL
Cost of Living Comparison
Groceries:

6.2% Less
Housing:

36.4% Less
Utilities:

6.0% Less
Transportation:

4.5% Less
Health:

2.4% Less
Previous slide
Next slide
Cost of Living Index

95.1

Index Score

Average Mortgage

$3,130

vs Average Rent: $1,853

Housing

92.7

Index Score

Utilities

99.3

Index Score

Gas

99.6

Index Score

Median Home Sales Price

$409,900

YoY Change: -0.3%

The “Cost of Living” index score provides a comparative assessment of the relative expense involved in maintaining a standard of living in a specific area, benchmarked against a national index score of 100.

Source: COLI; BLS; Consumer Price Index for All Urban Consumers (CPI-U): Selected areas, all items index, July 2023

Market Outlook

As the third quarter of 2023 concludes, Tampa’s multifamily housing market is on a growth trajectory with 16,626 units currently under construction and an additional 9,812 units projected to be completed in the next year. This incoming supply accentuates the need for a significant increase in demand to facilitate the full absorption of these units by late 2024. Nevertheless, Tampa continues to attract individuals and families relocating from costlier cities in the Northeast, which somewhat mitigates these concerns. This migration trend is not only holding steady but is also expected to accelerate in the upcoming years. Coupled with a thriving local economy, it shapes an optimistic, yet cautious, market outlook for Tampa’s multifamily housing sector.

Sources: RealPage; BLS; MSCI; The Council for Community And Economic Research (C2ER)

To Gain Further Insights Into The Tampa Market Please Reach Out To Our local Team

Image of Matt

Matt Ledom

Senior Director

Jhamil Moore

Senior Advisor

Samuel Ervin

Samuel Ervin

Associate Advisor

Have a question? Ask me here!