MARKET SNAPSHOT
$1,241 3Q 2024
91.8% 3Q 2024
871 [YTD: 2,720]
2.1% 3Q 2024
+10 BASIS POINTS
1,093 [YTD: 2,024]
Year-to-date Net absorption reached 2,720 units at the end of September, more than doubling the demand recorded during the same timeframe last year and closely aligning with the full-year figures from 2019 and 2024.
Charles, in particular, saw strong renter activity, pushing its occupancy rate to 95.5%, a 40-basis point increase year-over-year by the close of the third quarter.
As of the end of the third quarter of 2024, the St. Louis market recorded a 2.1% annual increase in average rents, securing the 19th highest ranking among these major markets.
871 UNITS
[YTD: 2,720]
Renter demand in St. Louis surged through the first three quarters of the year, driven by improved consumer sentiment. Absorption during this period reached approximately 2,720 units, more than doubling the demand recorded during the same timeframe last year. This strong rental activity enabled absorption to outpace the number of new units introduced, positioning the market for a robust finish to 2024 and positive momentum into 2025. Notably, renter demand in the third quarter was heavily concentrated in the submarkets of Mid County, Downtown St. Louis, and St. Charles County, which collectively accounted for nearly 68% of the quarter’s total demand.
1,093 UNITS
[YTD: 2,024]
Amid a heightened interest rate environment that has slowed the pace of new developments breaking ground, the construction pipeline has declined to its lowest level in four years in St. Louis. With 2024 poised to mark the second consecutive year of declining deliveries, the pace has notably slowed since peaking at 4,800 units in 2022; currently, just over 2,700 units are under construction. This reduction is helping alleviate the supply-side pressures that have impacted the market’s occupancy rates for nearly three years. Notably, the majority of the units currently under construction are concentrated in the St. Charles submarket, where developers are actively working on 700 units.
After weaker-than-normal absorption in 2023, renter demand in St. Louis has rebounded significantly through the first three quarters of 2024. Year-to-date, net demand reached 2,720 units by the end of September, nearly doubling the total from last year and closely aligning with the annual figures from 2019 and 2024. This surge has reversed the trend of supply outpacing demand over the past two years, which had caused a 200-basis point decline in the average stabilized occupancy rate during that period. However, with demand now moderately exceeding new supply, St. Louis’ average stabilized occupancy rate has improved for two consecutive quarters, showing a 10-basis point annual increase in the most recent quarter.
St. Charles, in particular, saw strong renter activity, pushing its occupancy rate to 95.5%, a 40-basis point increase year-over-year by the close of Q3. Looking ahead, if current economic conditions hold, St. Louis is expected to see further improvements in market fundamentals through the end of 2025, with the average occupancy rate projected to climb into the upper 92% range as the pipeline diminishes.
St. Louis has consistently outperformed many similarly sized markets in rent growth, routinely ranking within the top 20 of the 50 largest multifamily markets over the past six quarters. As of the end of the third quarter of 2024, the St. Louis market recorded a 2.1% annual increase in average rents, securing the 19th highest ranking among these major markets. A closer examination reveals that mid-range properties are showing strong performance, with an average rental rate increase of 3.1% in the year ending September 2024. In contrast, luxury properties, which are more impacted by new construction, experienced a more modest increase of 0.9% over the same period.
Notably, North County, one of St. Louis’s primary submarkets, experienced the largest annual rental increase, with rents rising 5.3% over the previous year as of the end of Q3 2024. Overall, 17 of St. Louis’s 20 submarkets reported annual increases in effective rents. Conversely, the remaining three submarkets experienced modest annual declines in average effective rents, with the Central West End submarket noting the sharpest decline at -1.2%.
In August 2024, the job market in the St. Louis Metro area demonstrated notable strength, according to the Bureau of Labor Statistics (BLS). The region added 36,000 jobs, reflecting a 2.6% growth rate. Several sectors posted significant gains, with Education and Health Services leading by adding 14,000 jobs, a 5.2% year-over-year increase. The Leisure and Hospitality sector followed closely, expanding by 12,900 jobs, an impressive 8.4% growth. The unemployment rate in St. Louis remained low at 3.9%, well below the national average of 4.2%.
August 2024 ANNUAL JOBS CREATED
AUGUST 2024 EMPLOYMENT GROWTH
AUGUST 2024 Unemployment rate
4.2% us August rate
Nominal Change
from August 2023
to August 2024: 14,000
Percent Change: 5.2%
Nominal Change
from August 2023
to August 2024: 12,900
Percent Change: 8.4%
Nominal Change
from August 2023
to August 2024: 2,900
Percent Change: 1.1%
Nominal Change
from August 2023
to August 2024: 2,400
Percent Change: 2.0%
Nominal Change
from August 2023
to August 2024: 1,600
Percent Change: 1.8%
| Sector | Nominal Change from August 2023 to August 2024 | Percent Change |
|---|---|---|
| Education and Health Services | 14,000 | 5.2% |
| Leisure and Hospitality | 12,900 | 8.4% |
| Trade, Transportation, and Utilities | 2,900 | 1.1% |
| Manufacturing | 2,400 | 2.0% |
| Mining, Logging, and Construction | 1,600 | 1.8% |
| Government | 1,400 | 1.0% |
| Financial Activities | 1,200 | 1.2% |
| Other Services | -100 | -0.4% |
| Professional and Business Services | -100 | -0.1% |
| Information | -200 | -1.0% |

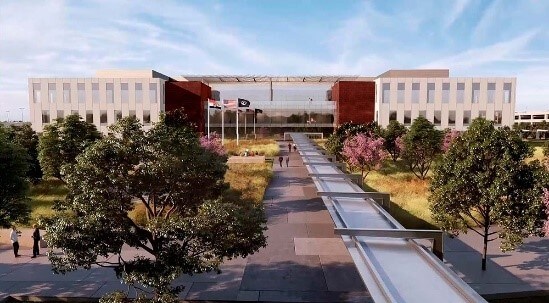
The new National Geospatial-Intelligence Agency (NGA) headquarters is nearing completion with occupancy set for fall 2025.

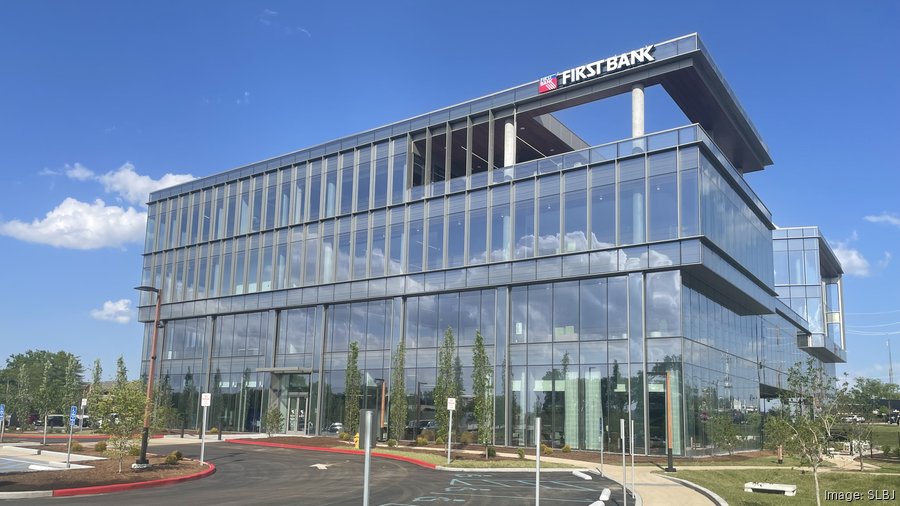
First Bank, a family-owned, full-service bank with branches in Missouri, Illinois, and California, inaugurates its new headquarters.

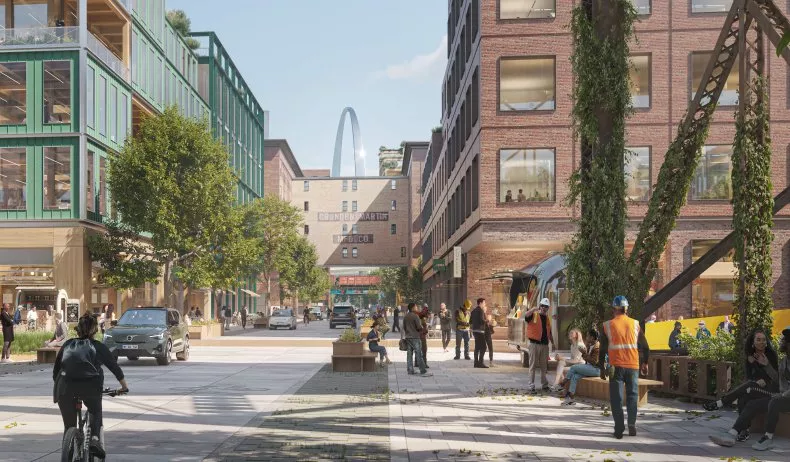
Gateway South is a mixed-use development designed to serve as the premier geographic hub for the construction industry.
At the close of the third quarter of 2024, a pivotal shift occurred as the pace of new unit deliveries slowed, resulting in two consecutive quarters of rising occupancy rates. By the end of Q3, half of St. Louis’ 20 submarkets demonstrated strong performance, with occupancy rates surpassing 94%.
The city is also experiencing a surge in commercial construction, particularly in the downtown area, which is expected to further boost housing demand. A key highlight is the opening of CITYPARK Stadium and the inaugural season of St. Louis City SC in Major League Soccer, both of which are bringing renewed energy and attention to the city. Additionally, the $210 million renovation of America’s Center is transforming St. Louis into a premier convention hub and tourist destination. Among the most significant redevelopment projects is the $1.2 billion Gateway South project, which is revitalizing the area just south of the Gateway Arch, creating a vibrant mixed-use district.
Looking ahead, St. Louis’ strong market fundamentals, paired with steady demand, provide a stable outlook for the city’s apartment market in the long term, despite short-term fluctuations in market conditions.
Sources: Costar; ESRI; U.S. Census Bureau; Yardi Matrix; U.S. Bureau of Labor Statistics


