MARKET SNAPSHOT
$1,006 3Q 2024
90.1% 3Q 2024
550 [YTD: 1,760]
2.2% 3Q 2024
+10 BASIS POINTS
636 [YTD: 2,380]
Demand in Oklahoma City has strengthened this year, with net absorption already surpassing the annual totals recorded from 2017 to 2024, while supply pressure remains manageable.
Rent growth in Oklahoma City has remained healthy over the past year, increasing by 2.2%—outpacing the U.S. average of approximately 1.0%.
Economic momentum is expected to stimulate the multifamily market moving into 2025, with rent growth anticipated to approach 4.0% by mid-2025, driven by steadily rising demand.
550 UNITS
[YTD: 1,760]
Demand in Oklahoma City has strengthened this year, with net absorption already surpassing the annual totals recorded from 2017 to 2024, while supply pressure remains manageable. Apartment demand has varied across submarkets, with Northwest Oklahoma City serving as a stabilizing force, driving the majority of net move-ins over the past year due to its younger renter demographic and strong population growth. Additionally, Canadian County is emerging as a key renter destination, with demand rising in recent quarters, fueled by new communities and robust growth along the market’s western edge.
636 UNITS
[YTD: 2,380]
The apartment development pipeline currently has 1,500 units under construction, well below the 10-year average of 2,600 units and representing just 1.5% of existing stock—significantly lower than the U.S. average of 3.5%. Throughout the most recent development cycle, construction activity in Oklahoma City has remained stable compared to peer Sun Belt markets. Development has been concentrated in Canadian County and Edmond, reflecting population growth and suburban expansion in affluent neighborhoods. Looking ahead, the construction pipeline is expected to shrink further as construction starts have significantly declined in 2024.
The Oklahoma City multifamily market is benefitting from a rebalancing of supply and demand, leading to more stable occupancies. By the third quarter of 2024, the market-wide average occupancy rate stood at 90.1%, up 10 basis points from the previous year and well above the 10-year low of 88.7% set at the end of 2016, when weaker demand was driven by the energy downturn. Occupancy rates varied across submarkets, reflecting differing levels of demand.
The Northwest Oklahoma City submarket experienced the strongest absorption over the past 12 months, outpacing new supply and recording an 80 basis-point increase in occupancy to 93.5%, marking the second-largest occupancy gain in the market. Other submarkets, including Norman, Outlying Cleveland County, Midwest City/Del City, and Central Oklahoma City, also recorded occupancy improvements. In contrast, the Edmond submarket, which experienced a significant expansion of inventory, saw the largest decline in occupancy, dropping 180 basis points to 92.5% by the end of Q3 2024.
Rent growth in Oklahoma City has remained healthy over the past year, increasing by 2.2%—outpacing the U.S. average of approximately 1.0%. Oklahoma City’s growth aligns more closely with other stable Midwest markets, contrasting with the Sun Belt, where supply pressures have tempered rent increases. Forecasts predict rent growth to approach 4% by 2025, supported by a manageable supply pipeline and stabilizing demand. Rents in the market remain affordable at just over $1,000 per month, a 42% discount compared to the national average. Luxury properties average $1,350 per month, while mid-tier properties are closer to $1,010 per month, reflecting the market’s overall composition.
Downtown Oklahoma City commands the highest rents, averaging $1,420 per month. Suburban areas such as Northwest, Northeast, Edmond, and Canadian County report rents exceeding $1,000 per month, driven by newer communities and higher-quality properties. In contrast, Central and South Oklahoma City, with a higher concentration of mid- to lower-tier properties, see average rents around $850 per month.
From August 2023 to August 2024, the Oklahoma City metro area experienced a 2.0% increase in total nonfarm employment, adding 13,900 jobs. Significant growth occurred in the Education and Health Services sector, which added 9,800 jobs (8.7% increase), and the Leisure and Hospitality sector, which grew by 3,100 jobs (3.9%). The Mining, Logging, and Construction sector also saw a substantial rise, with a 5.9% increase. Conversely, the Professional and Business Services sector experienced the most significant decline, losing 1,300 jobs (1.4%), while Financial Activities and Information sectors also saw job reductions.
August 2024 ANNUAL JOBS CREATED
AUGUST 2024 EMPLOYMENT GROWTH
AUGUST 2024 Unemployment rate
4.2% us August rate
Nominal Change
from August 2023
to August 2024: 9,800
Percent Change: 8.7%
Nominal Change
from August 2023
to August 2024: 3,100
Percent Change: 3.9%
Nominal Change
from August 2023
to August 2024: 2,000
Percent Change: 5.9%
Nominal Change
from August 2023
to August 2024: 1,400
Percent Change: 4.6%
Nominal Change
from August 2023
to August 2024: 100
Percent Change: 0.3%
| Sector | Nominal Change from August 2023 to August 2024 | Percent Change |
|---|---|---|
| Education and Health Services | 9,800 | 8.7% |
| Leisure and Hospitality | 3,100 | 3.9% |
| Mining, Logging, and Construction | 2,000 | 5.9% |
| Other Services | 1,400 | 4.6% |
| Manufacturing | 100 | 0.3% |
| Government | 0 | 0.0% |
| Information | -100 | -1.6% |
| Trade, Transportation, and Utilities | -300 | -0.2% |
| Financial Activities | -600 | -1.6% |
| Professional and Business Services | -1,300 | -1.4% |

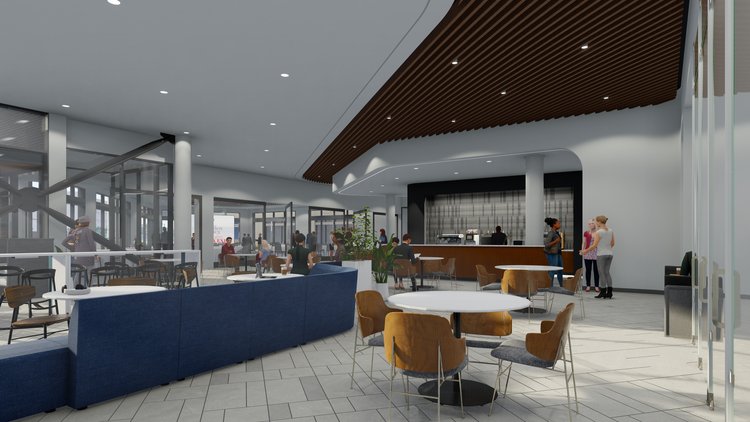
MAPS 4, the latest slate of projects, builds on decades of quality-of-life improvements for residents, with assets such as the new Oklahoma City Convention Center, Scissortail Park, OKC Streetcar, Bricktown Canal, and Chickasaw 6 Bricktown Ballpark, among others.

OKCID is a non-profit organization that aims to revitalize Oklahoma City’s entrepreneurial landscape and foster job growth. The district rests in Northeast OKC, focusing on research, technology, energy, healthcare, biomanufacturing, and aerospace.

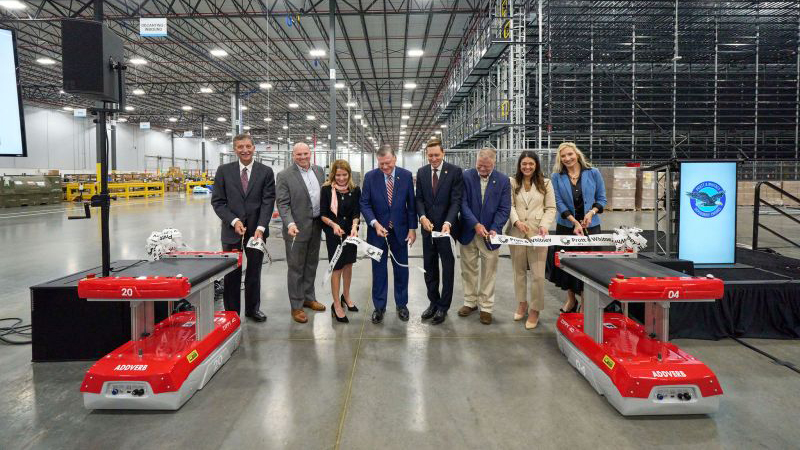
Pratt & Whitney, a Raytheon Technologies business, is advancing a $255 million investment through 2028 to establish a world-class sustainment facility in Oklahoma City.
As 2024 nears its end, Oklahoma City’s economic outlook is becoming increasingly robust, bolstered by diversifying industries and significant job growth, particularly in the mining, logging, and construction sector, as well as health services sectors. This economic momentum is expected to stimulate the multifamily market, with rent growth anticipated to approach 4.0% by mid-2025, driven by steadily rising demand. Additionally, ongoing urban development initiatives, such as the Metropolitan Area Projects (MAPS) program, continue to spur investment in Oklahoma City’s urban areas. These projects are enhancing the city’s appeal and solidifying Oklahoma City’s position as an emerging economic hub in the central United States.
Sources: Costar; ESRI; U.S. Census Bureau; Yardi Matrix; U.S. Bureau of Labor Statistics


