MARKET SNAPSHOT
$2,869 3Q 2024
96.2% 3Q 2024
2,630 [YTD: 6,875]
3.0% 3Q 2024
+20 BASIS POINTS
1,445 [YTD: 5,218]
Demand in Boston has been on the rise, with net absorption outpacing new deliveries in all three quarters of 2024. While absorption rates have increased over the past year, new completions have slowed, leading to tighter rental market conditions.
Steady leasing activity over recent quarters has sustained high occupancy levels, driving rent growth upward. With the supply side stabilizing quickly, a healthy balance of market fundamentals is emerging.
Rent growth has rebounded to align with the ten-year average of 3% annually, significantly outpacing the national benchmark of 1%. With an average rent of $2,869, Boston remains one of the most expensive rental markets in the country.
2,630 UNITS
[YTD: 6,875]
For the third consecutive quarter, rental demand in Boston, as measured by net absorption, has exceeded new completions, driving higher occupancy rates throughout 2024. Absorptions have risen 36% year-over-year, reaching a three-year high of around 2,600 units this quarter, while deliveries have significantly declined over the same period. Net absorption is projected to outpace new completions by 32% in 2024, marking the second-largest margin ever recorded in Boston’s market, surpassed only by the 2021 levels.
Demand has been strongest in the southern suburban submarkets, including South Shore, South Plymouth County, and Quincy/Milton/Randolph, which together accounted for a quarter of recent absorptions. Centrally located areas such as Fenway/Mission Hill and Allston/Brighton also saw significant demand. In contrast, other infill neighborhoods like Downtown Boston and northern suburban communities have experienced weaker demand.
1,445 UNITS
[YTD: 5,218]
In response to high interest rates and increased building costs, developers in Boston have reduced construction starts, leading to a continued decline in the construction pipeline. The number of units under construction in the metro area dropped by 8% year-over-year, while new completions saw a more significant decline of 56% over the same period. Approximately 7,000 units are expected to be delivered in 2024, marking the smallest total since 2016 and representing about 2.5% of the total rental inventory. In comparison, the national apartment inventory is projected to grow by around 2% in 2024.
Around 40% of all units under construction in the metro area are concentrated in four submarkets, including three adjacent areas in the inner northern suburbs. Together, these areas—Everett/Malden/Medford/Melrose, Route 1 North, 93 North, and Somerville/Charlestown—account for approximately 7,000 units in the pipeline. Significant supply additions are also underway in the Allston/Brighton submarket to the southwest, with around 1,000 units under construction, representing 9% of this submarket’s inventory.
After hitting a three-year low of 95.9% in late 2023, the average stabilized occupancy rate has slightly increased to 96.2%, which is in line with its ten-year average of 96.0% and above the national rate of 94.0%. Boston’s occupancy levels have typically remained above the national average, with the exception of a period between Q2 2024 and Q2 2021, when pandemic-driven migration from major cities peaked. Before the pandemic, the gap to the national rate averaged about 100 basis points, indicating that Boston’s current relative position is quite strong.
In addition to experiencing some of the highest rent growth, the New Hampshire Beaches submarket in the far northern part of the metro area boasted one of the highest average occupancy rates at 97.8%, second only to Strafford County. In contrast, the centrally located Roxbury/Dorchester submarket had the only aggregate occupancy rate below the national benchmark, despite recording the highest overall rent growth. Similar to rent trends, upper-tier properties were underperforming, with an average stabilized occupancy rate of 95.3%, compared to rates of 96.0% to 96.8% for other property classes.
The Boston market experienced 3.0% year-over-year rent growth in the current quarter, closely aligning with its 10-year average of 3.3% and significantly surpassing the national benchmark of 1.0%. This performance positions Boston among the top ten multifamily markets in the country for rent growth and among the most expensive rental markets nationwide, following only a few metro areas in and around New York City and the San Francisco Bay Area. When compared to the more subdued rent growth in regional peer markets, consistent annual increases of around 3% have proven attractive to investors.
Rents have increased at a year-over-year rate of 5% or more in both inner-city and outlying areas, including Roxbury/Dorchester, New Hampshire Beaches, and Route 2. In contrast, rent gains have been more limited in South Boston/Seaport, one of Boston’s priciest submarkets. Rent growth for upper-tier properties has slowed more sharply since early 2022, reflecting the delivery of new supply while demand is still normalizing. Luxury properties experienced an average rent increase of 2.1% over the past year, compared to growth rates of 3.1% and 3.9% for mid- and lower-tier workforce properties, respectively.
Boston’s economy is expanding at a moderate pace, fueled by a highly educated workforce that bolsters the metro area’s knowledge-based industries. The region added approximately 33,800 jobs over the past year, which equates to 1.2% annual growth that is slightly below the national job growth figure (1.6%). The leisure and hospitality industry was a leader in job growth and saw a 5.9% increase in employment over the last year, followed by education and healthcare and government sectors at 2.9% and 2.0% annual growth, respectively. Their job gains compensated for contractions in the information industry, which saw a 5.3% decline. The metro area’s current unemployment rate of 4.3% is 110 basis points higher than in August 2023 and similar to the national average of 4.4%.
August 2024 ANNUAL JOBS CREATED
AUGUST 2024 EMPLOYMENT GROWTH
AUGUST 2024 Unemployment rate
4.4% us August rate
Nominal Change
from August 2023
to August 2024: 17,300
Percent Change: 2.9%
Nominal Change
from August 2023
to August 2024: 16,700
Percent Change: 5.9%
Nominal Change
from August 2023
to August 2024: 6,700
Percent Change: 0.7%
Nominal Change
from August 2023
to August 2024: 5,800
Percent Change: 2.0%
Nominal Change
from August 2023
to August 2024: 3,000
Percent Change: 1.6%
| Sector | Nominal Change from August 2023 to August 2024 | Percent Change |
|---|---|---|
| Education and Health Services | 17,300 | 2.9% |
| Leisure and Hospitality | 16,700 | 5.9% |
| Mining, Logging, and Construction | 6,700 | 0.7% |
| Government | 5,800 | 2.0% |
| Financial Activities | 3,000 | 1.6% |
| Other Services | 1,100 | 1.0% |
| Trade, Transportation, and Utilities | 400 | 0.1% |
| Professional and Business Services | -2,100 | -0.4% |
| Information | -4,300 | -5.3% |
| Manufacturing | -4,600 | -2.5% |

Biotech company Vertex Pharmaceuticals is developing an expansion to its existing facilities in Boston’s Seaport district. The 345,000-square-foot addition will be connected to the recently completed Jeffrey Leiden Center, and the company has just renewed its 15-year lease for 1.1 million square feet of office and laboratory space in the area.

Axon Enterprises, a manufacturer of taser and shock weapons, is opening its East Coast headquarters in Boston’s Back Bay neighborhood. The company has leased 25,000 square feet of industrial space and plans to expand further in a phased approach.

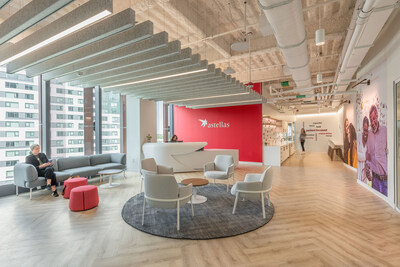
Astellas Pharma Inc. recently opened a 62,000-square-foot state-of-the-art life sciences facility in the Cambridge Crossing (CX) neighborhood.
Boston is poised to remain an attractive major market for multifamily investors, especially if demand stays steady and rent growth continues to outperform expectations. Net absorption is projected to stay relatively balanced with new completions in the short term, while the shrinking construction pipeline should further boost occupancy rates and rents. The city’s knowledge-based economy, driven by a highly educated workforce and numerous higher-education institutions, continues to attract talent and investment, stimulating job growth and sustained rental demand. Overall, Boston’s steadily improving market fundamentals will help it maintain its position as one of the top metro areas in the country for rent growth and occupancy.
Sources: Costar; ESRI; U.S. Census Bureau; Yardi Matrix; U.S. Bureau of Labor Statistics


