MARKET SNAPSHOT
$1,570 3Q 2024
91.0% 3Q 2024
6,843 [YTD: 17,128]
-5.4% 3Q 2024
-70 BASIS POINTS
10,033 [YTD: 26,730]
Supply continues to outpace demand, but absorption levels have reached record highs. Net absorption through the third quarter of 2024 has already more than doubled the total for all of 2023 and is on track to reach a ten-year annual high of 22,837 units.
The development pipeline remains large but has begun to contract. After peaking in 2023, the number of units under construction in the metro area has steadily decreased to 22,147, the lowest level since 2024.
Rent trends remain negative as the rental market continues to recover from the effects of the supply overhang. Some centrally located submarkets have started to experience rent growth, though the increases have been limited. The overall rent trend has been skewed downward by significant declines in outlying submarkets.
Occupancy rates have stabilized, with average occupancy remaining at 91% over the past four quarters. Meanwhile, absorptions have increased, indicating that occupancy rates may begin to rebound as the construction pipeline continues to shrink.
6,843 UNITS
[YTD: 17,128]
Although new supply continues to outpace net demand, absorption levels reached new heights in 2024. Through the first three quarters of the year, demand has more than doubled the 2023 total (7,682 units) and is on track to reach a ten-year high, with 22,837 units expected to be absorbed by year-end if the current pace continues. Additionally, absorption has increased steadily by 22% per quarter throughout 2024, following a 200% jump between Q4 2023 and Q1 2024, highlighting growing demand, while deliveries have only risen 8% per quarter.
This surge in demand has been driven primarily by continued economic growth and renter in-migration, especially to suburban areas like Georgetown-Leander and Southeast Austin, which offer lower rents and abundant quality-of-life amenities, accounting for 27% of net annual absorption.
10,033 UNITS
[YTD: 26,730]
Apartment construction remains at historic highs, with 22,147 units in the development pipeline—well above the 14,000-unit average between 2017 and 2019. Nationally, Austin has the third-largest pipeline, trailing only New York City and Dallas-Fort Worth. However, declining occupancy rates, stricter underwriting standards, and rising capital costs have begun to affect new construction.
After reaching a ten-year high in 2023, Austin’s development pipeline has steadily declined. The number of units under construction in the metro area peaked at 54,119 in the first quarter of 2023 and has since dropped to 22,147 units in the current quarter, the lowest level since 2024. Although deliveries remain elevated due to the surge in construction over the past two years, there is a lag in the effects of declining construction starts, and net deliveries are expected to drop to an average of around 2,250 units in 2025. New construction has been concentrated in the suburbs and smaller outlying communities, with the Georgetown-Leander, Round Rock, and North Austin submarkets accounting for over a third of all deliveries over the past year.
The overall stabilized occupancy rate (excluding properties in lease-up) has dropped by 70 basis points registering an average rate of 91.0% at the close of the third quarter. Although below the historical average, occupancy rates have shown resilience over the past year considering the historical level of supply that has been added to the local inventory. With the construction pipeline beginning to taper and absorption rising, occupancy rates are expected to continue stabilizing and may soon begin to rebound.
Occupancy rates are generally balanced across all product classes, ranging from 88.9% for lower-tier developments to 91.6% for upper-tier properties. However, the data for upper-tier properties is somewhat skewed due to a substantial number of units in lease-up at new developments that are excluded from stabilized occupancy rates. Similar to rent trends, the worst-performing submarkets were in outlying communities such as Buda-Kyle and San Marcos. In contrast, submarkets like Downtown, Northeast, Riverside, and Georgetown-Leander have experienced slight occupancy increases of about 1% over the past year.
After experiencing some of the highest rent growth in the nation at 15.9% annually at the end of 2021, average effective rents declined by 5.4% year-over-year in the most recent quarter. The trend reversal observed in Austin over the past two and a half years marks one of the sharpest rent decelerations in the country. This shift can be attributed to an influx of new supply that outpaced demand, particularly in the second half of 2022. However, rents increased in the Central and West Austin submarkets over the past year, and the overall negative rent trend was skewed downward by several underperforming outlying submarkets, such as Buda-Kyle and Far West Austin.
Competition continues to exert downward pressure on rents in the high-end luxury market, which experienced the largest rent decline at 5.5% over the past year, while mid-tier properties saw a decrease of 4.9%. In contrast, rents at lower-tier workforce properties rose by 4% during this period.
The regional economy continues to expand, adding 17,300 jobs over the past year, while the unemployment rate has remained largely unchanged. Total nonfarm employment grew by 1.3% during this period, with the strongest job growth occurring in the mining, logging, and construction sector, which saw a 5.8% annual increase, followed by other services at 4.0%, and leisure and hospitality with a 3.7% increase. The information sector was the only industry to experience a decline, down 4.9%.
The metro area’s unemployment rate was 3.7% in August 2024, just 10 basis points higher than in August 2023 and below the national average of 4.2%. According to the Texas Workforce Commission, employment in the metro area is expected to grow by 5.0% between 2023 and 2025, representing an annual gain of around 24,370 jobs.
August 2024 ANNUAL JOBS CREATED
AUGUST 2024 EMPLOYMENT GROWTH
AUGUST 2024 Unemployment rate
4.4% us August rate
Nominal Change
from August 2023
to August 2024: 5,500
Percent Change: 3.7%
Nominal Change
from August 2023
to August 2024: 4,900
Percent Change: 5.8%
Nominal Change
from August 2023
to August 2024: 3,700
Percent Change: 2.4%
Nominal Change
from August 2023
to August 2024: 3,600
Percent Change: 1.9%
Nominal Change
from August 2023
to August 2024: 2,300
Percent Change: 1.1%
| Sector | Nominal Change from August 2023 to August 2024 | Percent Change |
|---|---|---|
| Leisure and Hospitality | 5,500 | 3.7% |
| Mining, Logging, and Construction | 4,900 | 5.8% |
| Education and Health Services | 3,700 | 2.4% |
| Government | 3,600 | 1.9% |
| Trade, Transportation, and Utilities | 2,300 | 1.1% |
| Other Services | 2,100 | 4.0% |
| Financial Activities | 600 | 0.7% |
| Manufacturing | 0 | 0.0% |
| Professional and Business Services | -2,600 | -0.9% |
| Information | -2,600 | -4.9% |

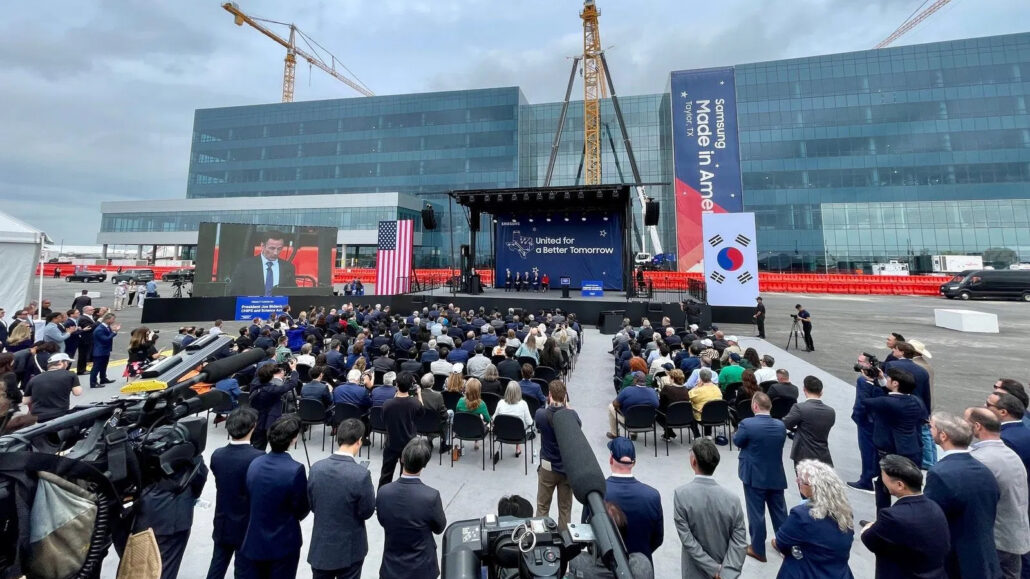
In May 2024, Samsung Electronics announced a planned investment of $45 billion in Central Texas over the next decade. The investment includes new offices in Austin and The Woodlands, a new chip plant in Taylor, and additional planned manufacturing facilities in Williamson County.


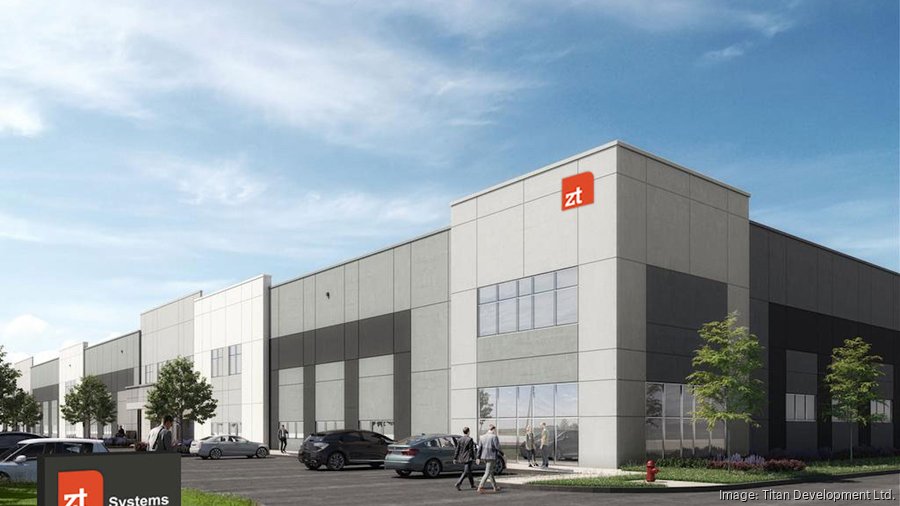
ZT Systems is establishing a new state-of-the-art manufacturing facility in the NorthPark 35 industrial park, located just north of Austin. This facility will be focused on producing cloud-computing and AI hardware, and it is expected to be fully operational by the end of 2024.
The Austin rental market has begun to recover from the impacts of a supply overhang, though it remains in the early stages of recovery. Absorption levels have been steadily increasing and are projected to reach a balanced level with new deliveries in 2025, largely due to a shrinking development pipeline in a market with an expanding population. Austin continues to be one of the fastest-growing metro areas in the nation, driven by extensive ongoing economic development and private investments that have stimulated household in-migration. This growth has also supported stable or increased values in the for-sale housing market, making homeownership unaffordable for many renter households. These factors are expected to improve occupancy rates, reduce concession usage, and ultimately support a return to rent growth. As such, average rents are forecasted to begin increasing on a quarterly basis starting in early 2025, with year-over-year growth expected by the end of that year.
Sources: Costar; ESRI; U.S. Census Bureau; Yardi Matrix; U.S. Bureau of Labor Statistics


