
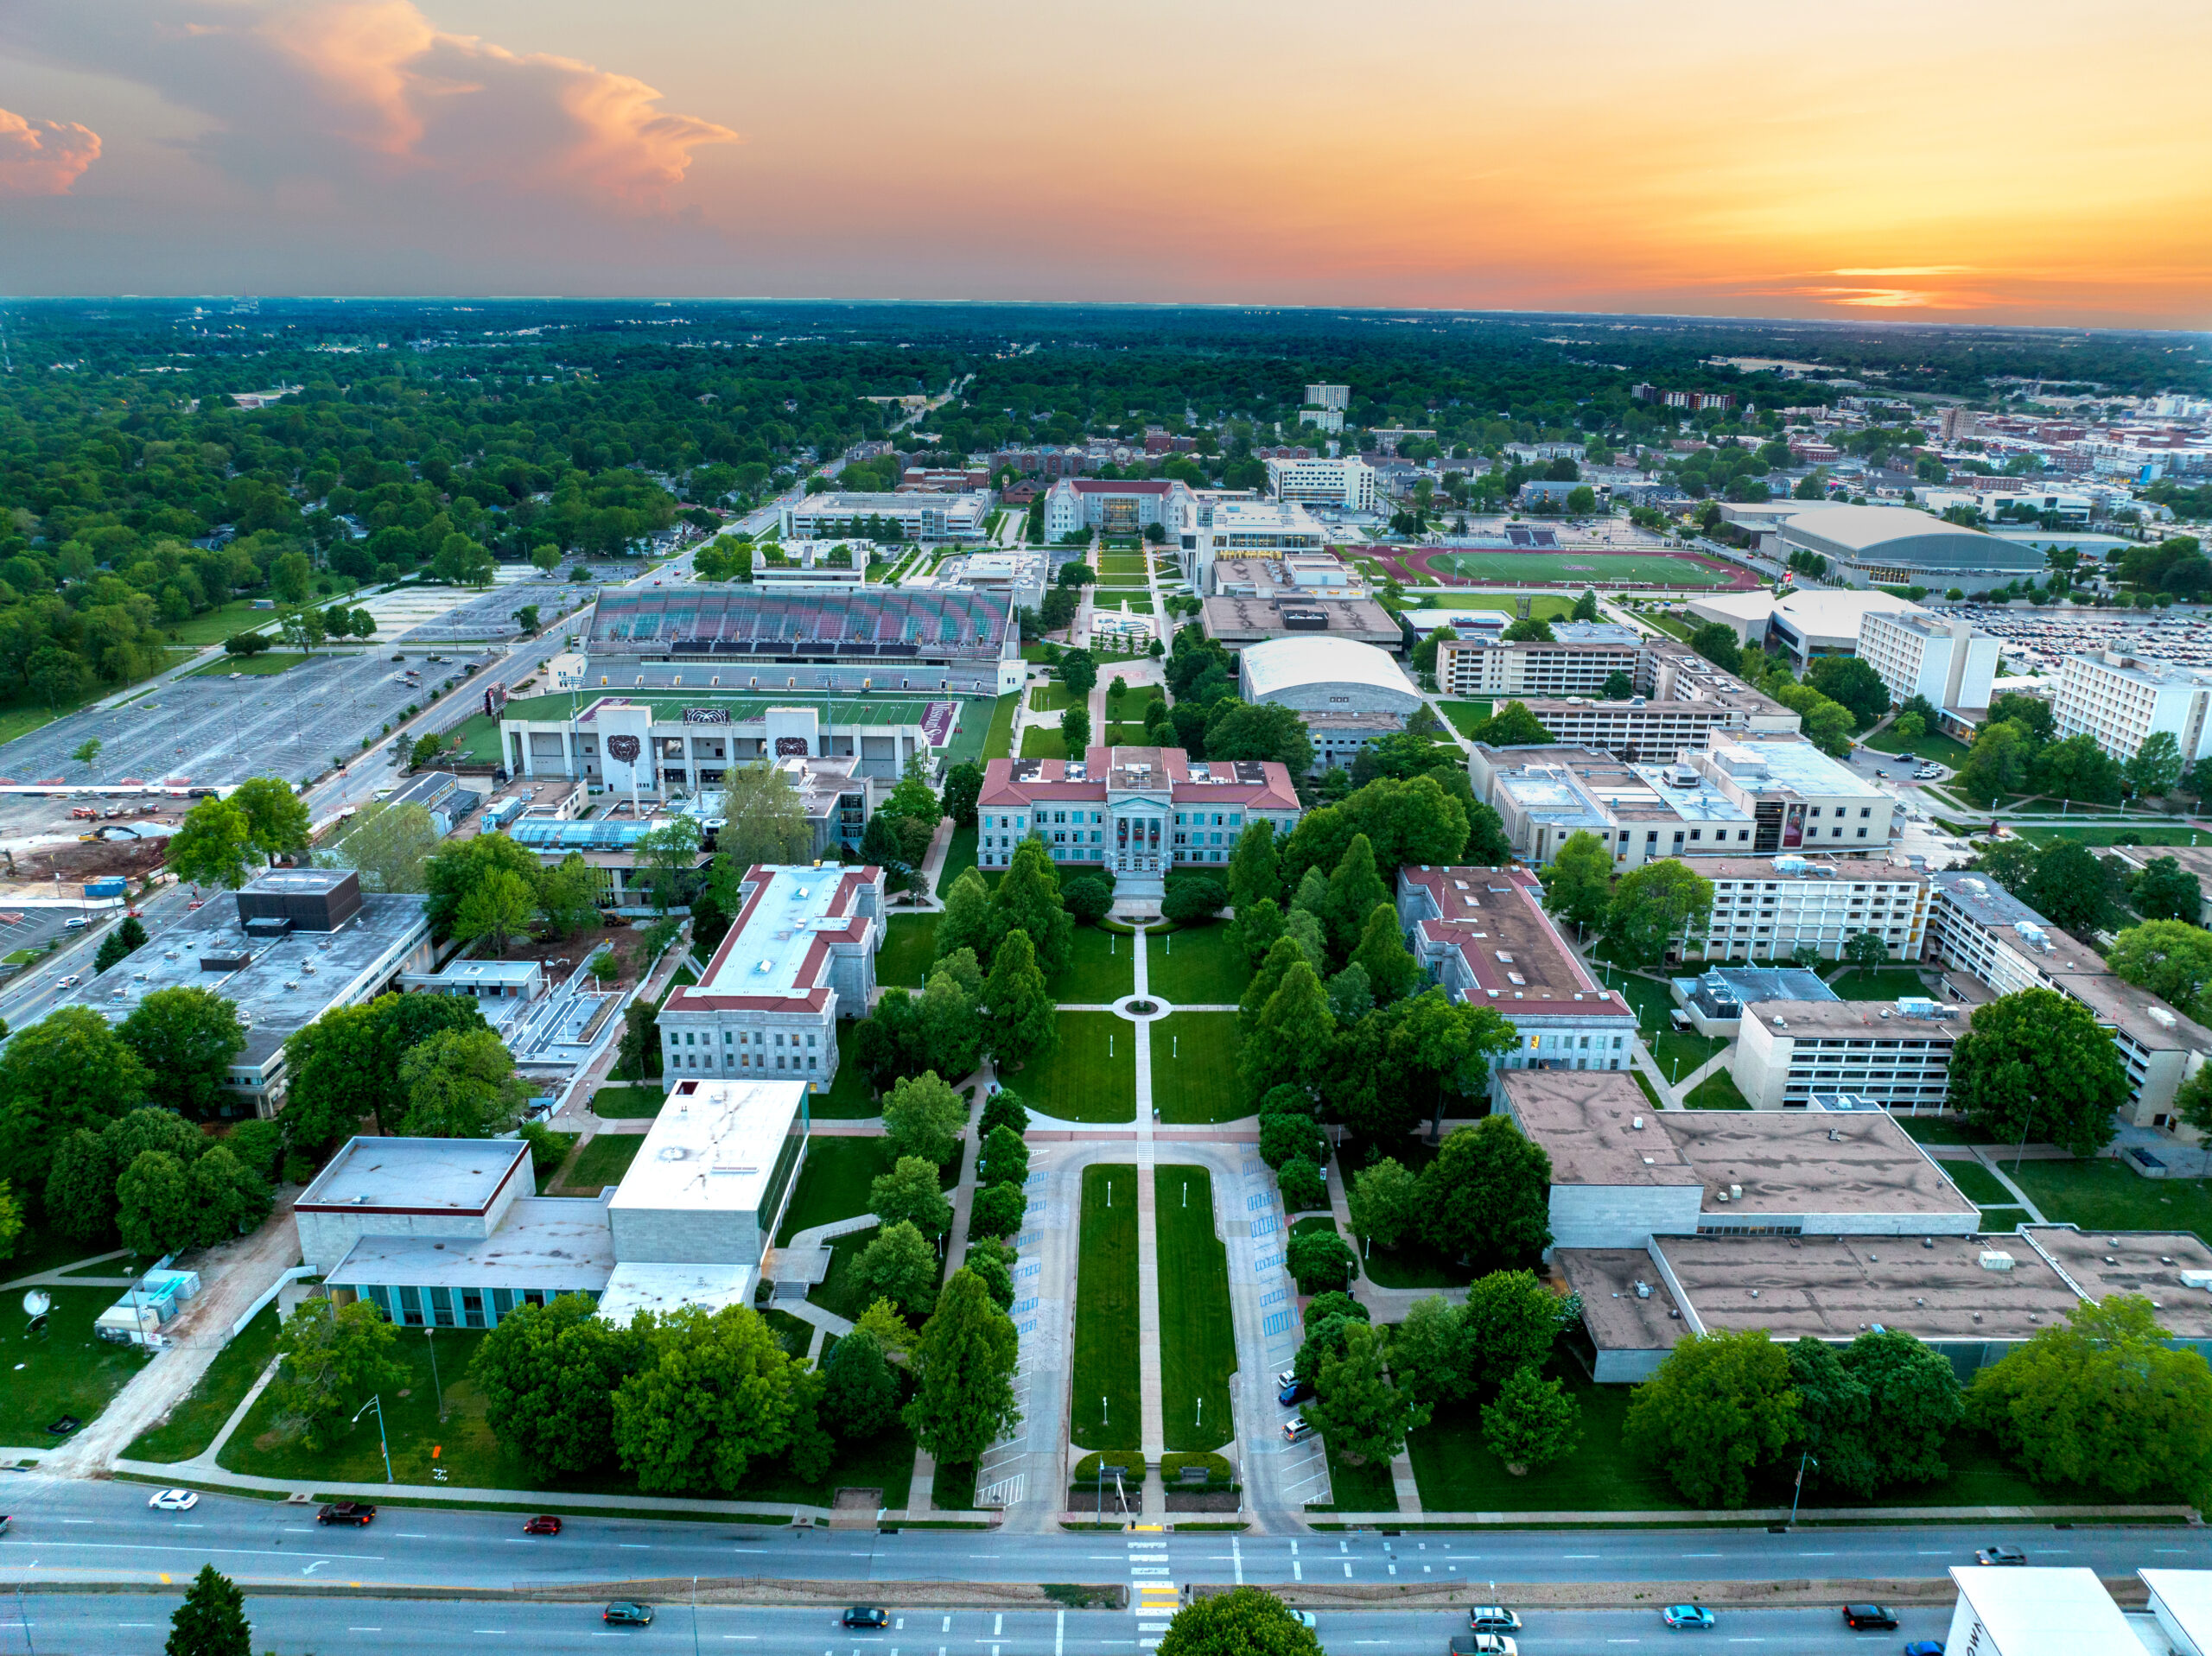
$0
Average Rent
$1,028 average rent in Springfield, MO, Q2 2026
0%
Occupancy Rate
94% occupancy rate Springfield, MO, Q2 2026
0
T4Q Net Absorption
394 T4Q net absorption in Springfield, MO, Q2 2026
0%
Annual Rent Change
2% annual rent change in Springfield, MO, Q2 2026
0
BPS Annual Occupancy Change
-120 BPS annual occupancy change in Springfield, MO, Q2 2026
0
T4Q Unit Completions
1,099 T4Q net absorption in Springfield, MO, Q2 2026
KEY TAKEAWAYS
- Trailing 12-month deliveries of 1,099 units have outpaced absorption of 394 units, but the construction pipeline has fully emptied to 0 units, signaling the end of Springfield’s supply wave.
- Pricing power is returning, with rents up 1.9% year-over-year to $1,028 per unit after a stretch of supply-driven softness, a pace that holds up well against most of the market’s regional peers.
- Occupancy of 93.8% is down 120 basis points from a year ago, though the pace of decline has slowed as leasing activity picked up in Q2, a sign the market may be nearing a bottom.
MARKET OUTLOOK
Springfield is past the peak of its supply cycle, and the market’s trajectory over the next two to four quarters should favor improving fundamentals…
Recent Heartland Research
Other investors in your market are reading this.
The data that informs when to sell, when to hold, and when the window is closing.