$846 4Q 2023
$880 4Q 2024
4.0%
92.6% 4Q 2023
92.2% 4Q 2024
-40 points
307.9K 2023
309.3K 2024
3.2% 2023
3.8% 2024
* Please note that these employment figures have been adjusted for seasonal variations and are based on Moody’s Analytics forecast as of January 1, 2024.
** Please note that these unemployment rates are estimates that have not been adjusted for seasonal variations, and they are derived from Moody’s Analytics forecast as of January 1, 2024.
In 2024, the Bel Aire/Northeast submarket is set to significantly grow, adding around 300 units, bolstered by the establishment of Integra Technologies’ headquarters and manufacturing facility, expected to generate 2,500 jobs, and drive robust demand in the area.
The manufacturing sector in Wichita is expected to see significant growth in 2024, with an estimated net addition of 600 jobs, primarily fueled by the Textron Aviation contract with NetJets to provide up to 1,500 aircraft.
FORECASTED ABSORPTION
FORECASTED NEW SUPPLY

In 2023, Wichita’s multifamily market experienced a positive turn in annual absorption with 175 units absorbed, yet this uptick was overshadowed by the concurrent arrival of 638 new units, leading to a decline in occupancy to 92.5%. Particularly, occupancy losses in the East and Southeast submarkets counterbalanced gains elsewhere.
Moving into 2024, the forecast suggests a building momentum with expected net absorption of around 500 units, nearing the 600 units projected for delivery. This narrowing gap between demand and new supply should mitigate further major drops in occupancy. However, the surplus from 2023 will continue to impact the market, with operators working to fill the remaining vacant units from the previous year. Consequently, occupancy is projected to decrease slightly, by 40 basis points, settling at 92.2%.
Wichita’s current construction pipeline consists of 960 units, accounting for 2.7% of the total inventory. Out of these units, 611 are expected to be completed in 2024. A significant number of these units are under development in the Bel Aire/Northeast submarket. This submarket’s growth prospects are bolstered by Integra Technologies’ decision to establish its headquarters and manufacturing facility in Bel Aire, a move projected to create 2,500 jobs and drive substantial growth in the coming years.
The West submarket is another key area in Wichita’s growth, with nearly 500 units under construction, reflecting developers’ response to residents’ preference for more space in outer suburbs. Looking beyond 2024, a significant drop-off in apartment development is anticipated, setting the stage for a scenario where demand is likely to exceed supply. This imbalance is expected to exert upward pressure on rents.
Average Monthly Mortgage Payment
Average Monthly Rent
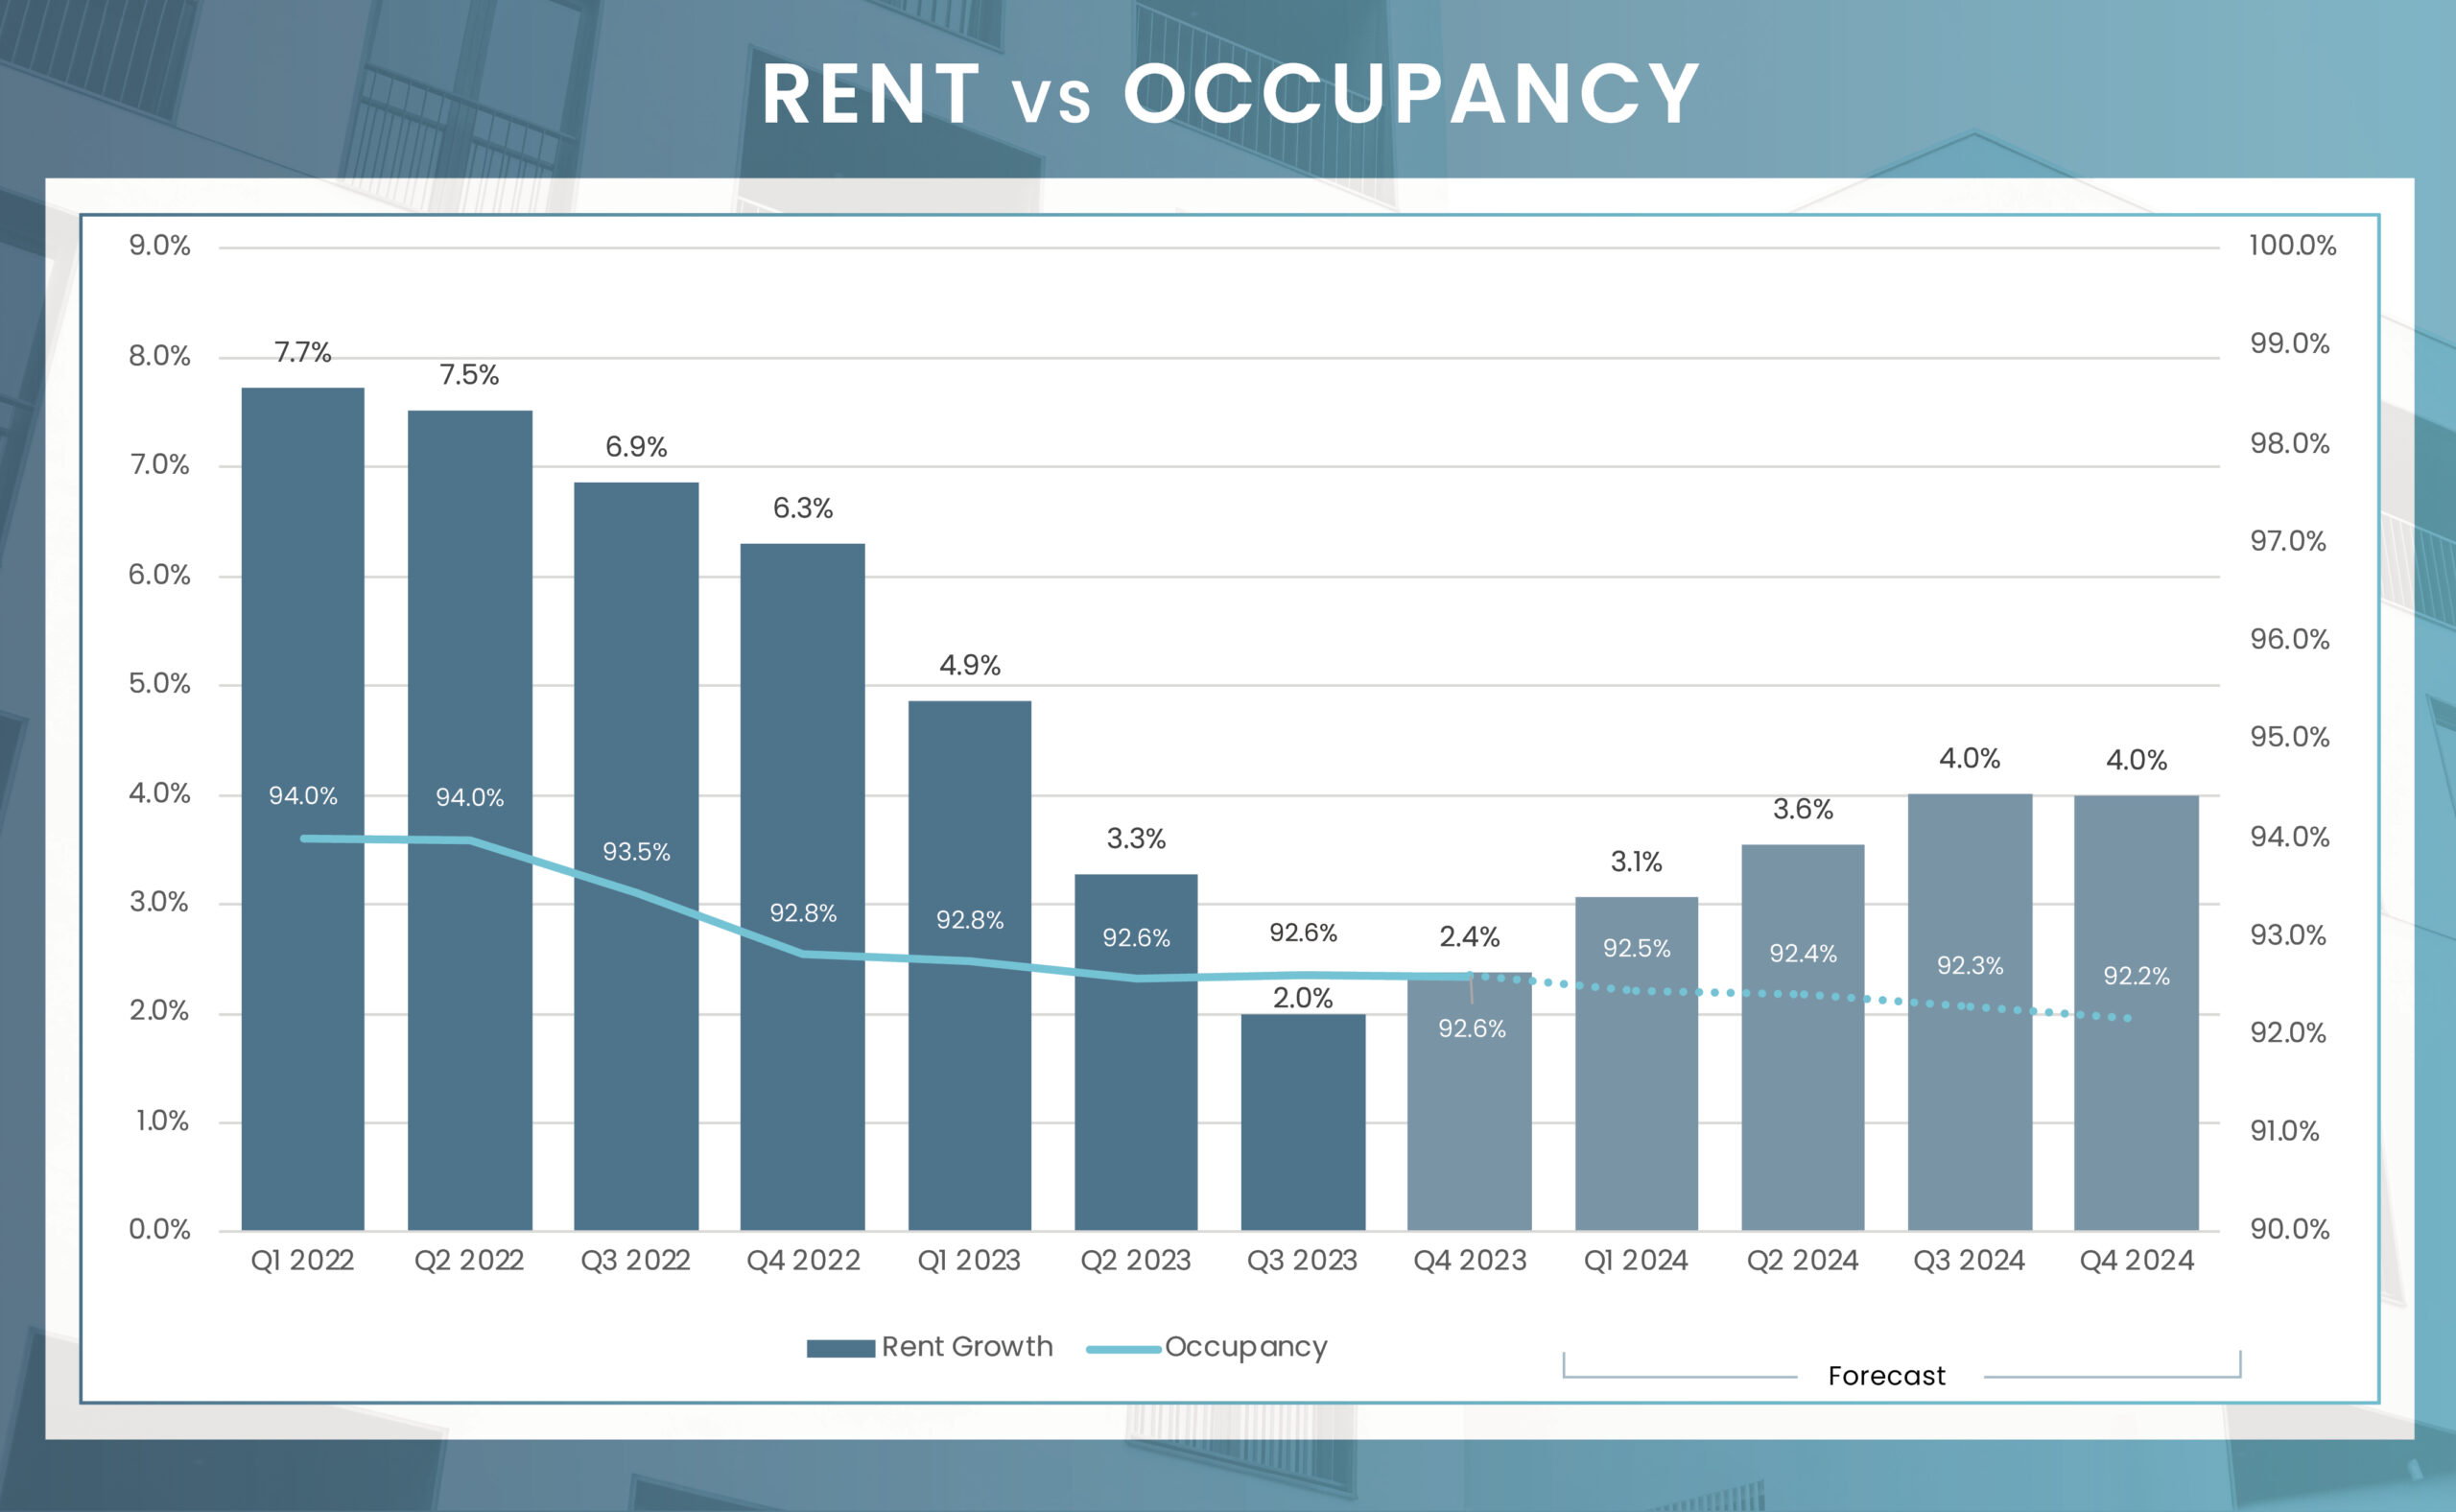
While Wichita hasn’t experienced the high peaks in rent growth seen in some other markets, its performance over the past five years has been consistent. This consistency helped power rent growth to a 2.5% increase over the past year, significantly outperforming the national average growth rate of less than one percent.
Looking ahead to 2024, Wichita is poised to maintain this strong trajectory, defying the national trend. The onset of the spring leasing season is expected to stimulate market absorption and push rent prices upward. By the end of 2024, Wichita’s annual rent growth is anticipated to accelerate notably, potentially reaching around 4.0%. This outlook underscores the sustained consistency of Wichita’s rental market.
| Submarket | Q4 2023 Stabilized Occupancy | Q4 2024 Stabilized Occupancy (f) | Annual Occupancy Change (2024/2023) | Q4 2023 Average Monthly Rent | Q4 2024 Average Monthly Rent (f) | Annual Rent Change (2024/2023) |
|---|---|---|---|---|---|---|
| Downtown Wichita | 81.4% | 80.7% | -0.7% | $1,010 | $1,054 | 4.4% |
| Southeast | 93.5% | 93.1% | -0.4% | $702 | $732 | 4.3% |
| Derby/Haysville | 98.0% | 97.7% | -0.2% | $940 | $980 | 4.2% |
| North | 90.9% | 90.5% | -0.5% | $645 | $672 | 4.2% |
| Harvey County | 96.1% | 95.7% | -0.4% | $737 | $768 | 4.1% |
| Butler County | 94.5% | 94.2% | -0.4% | $1,074 | $1,117 | 4.0% |
| South/Southwest | 90.5% | 90.0% | -0.5% | $701 | $729 | 4.0% |
| Bel Aire/Northeast | 95.7% | 95.4% | -0.3% | $970 | $1,009 | 4.0% |
| West | 93.4% | 93.0% | -0.4% | $840 | $873 | 3.9% |
| Northwest | 97.0% | 96.6% | -0.4% | $1,110 | $1,152 | 3.8% |
| East | 88.6% | 88.1% | -0.5% | $952 | $987 | 3.7% |
| Sedgwick County | 95.8% | 95.2% | -0.6% | $1,139 | $1,165 | 2.3% |
| Market | 92.6% | 92.2% | -0.4% | $846 | $880 | 4.0% |
4Q 2023 Unit Inventory
Number of Units Under Construction
Number of Units UC Delivering
In the Next 4 Quarters
| Submarket | Unit Inventory: 3Q 2023 | Units Under Construction | % of Existing Inventory UC | % of Total UC | Units UC Delivering In the Next 4 Quarters |
|---|---|---|---|---|---|
| Bel Aire/Northeast | 4,216 | 316 | 7.5% | 32.9% | 294 |
| Butler County | 790 | 106 | 13.4% | 11.0% | 105 |
| Derby/Haysville | 1,626 | 0 | 0.0% | 0.0% | 0 |
| Downtown Wichita | 1,790 | 0 | 0.0% | 0.0% | 0 |
| East | 3,241 | 40 | 1.2% | 4.2% | 0 |
| Harvey County | 458 | 0 | 0.0% | 0.0% | 0 |
| North | 3,661 | 0 | 0.0% | 0.0% | 0 |
| Northwest | 1,728 | 0 | 0.0% | 0.0% | 0 |
| Sedgwick County | 660 | 0 | 0.0% | 0.0% | 0 |
| South/Southwest | 3,838 | 0 | 0.0% | 0.0% | 0 |
| Southeast | 6,566 | 0 | 0.0% | 0.0% | 0 |
| West | 6,374 | 498 | 7.8% | 51.9% | 212 |
| Market | 34,948 | 960 | 2.7% | 100.0% | 611 |
Historically, Wichita’s multifamily market hasn’t been a hotspot for multifamily transaction activity, as evidenced by MSCI data showing an average annual sales volume of $36 million from 2014 to 2019, with some years, like 2017, recording as low as $6.1 million. However, there’s been a notable shift in the investment landscape post-pandemic. In the past four years, the average annual multifamily investment sales volume has surged to $91.6 million, with 2023 registering a commendable total of $83.2 million.
Despite this uptick in activity, the composition of property owners in Wichita hasn’t seen significant changes. Local owners have been active in divesting assets, yet the overall mix of owners remains relatively stable. Over the last twelve months, private investors have been particularly dominant in the market, accounting for 71% of all purchases.
* Trailing 4Q average PPU
* Preliminary Data from RCA – Individual transaction $2.5M +
P=Preliminary

| Sector | Employment Change 2023 to 2024 | Percent Change |
|---|---|---|
| Overall Employment | 1,400 | 0.7% |
| Manufacturing | 800 | 0.6% |
| Construction | 300 | 1.2% |
| Trade, Transport., & Utilities | 100 | 1.1% |
| Information | 0 | 0.4% |
| Financial Activities | (100) | -0.1% |
| Professional & Business Services | (500) | -0.8% |
| Education & Health Services | 100 | -1.7% |
| Government | 0 | 0.2% |
| Leisure & Hospitality | 700 | 0.0% |
| Other Services | 0 | 2.1% |
The economic outlook for Wichita is highly promising, bolstered by significant developments in its key sectors. A major highlight is Textron Aviation’s substantial long-term contract to sell 1,500 aircraft, showcasing a robust demand in the aviation industry. Complementing this, Integra Technologies’ decision to establish a headquarters and manufacturing facility in the metro area is set to create an impressive 2,500 new jobs. This expansion will also stimulate the construction sector, expecting to add 200 jobs to support this project. Additionally, the manufacturing sector is poised for growth, with an estimated increase of 600 positions, primarily driven by the Textron Aviation contract.
These pivotal developments lay a strong foundation for Wichita’s economy, driven by core industry growth and significant new investments. The combined impact of these factors positions Wichita favorably for a growth trajectory that could surpass broader economic trends.