Covering this topic in July 2025, we laid out the thesis: generative AI is coming for white-collar work, and if jobs evolve, so does housing demand. We sketched a future where the barbell economy reshapes renter profiles, certain markets pull ahead, and Class B multifamily sits in an uncomfortable gray zone.
A new study from Anthropic, drawing on over a million real AI conversations, helps us contextualize this in far greater detail. Separately, the Brookings Institution has added a layer most AI labor analyses overlook, examining not just which workers face exposure but which appear better positioned to recover if their roles are disrupted.
Together, these two reports paint a picture that's more nuanced, and more actionable, than the headlines suggest. For multifamily investors, the implications are significant.
Section 1: AI Is Already Reshaping Work
For years, the AI-and-labor conversation has been dominated by forecasts — models predicting what AI could eventually automate, economists debating timelines, executives making bold proclamations. What has been missing is a ground-level measure of what AI is doing inside real workplaces today.
The Anthropic Economic Index, published in January 2026, fills that gap. By analyzing anonymized conversations across more than a million Claude interactions, researchers can now track AI usage by task, occupation, geography, and mode — distinguishing between AI that's augmenting a human worker and AI that's outright replacing a task.
The data reflects how quickly this has moved. Of the jobs sampled, 49% now see Claude being used for at least a quarter of their tasks, up from 36% less than a year ago. That is not a gradual drift. That is a rapid reconfiguration of how professional work gets done.
Which Jobs Are Being Hit
The Anthropic report introduces "observed exposure" — a measure that combines theoretical AI capability with real-world usage data. It produces some counterintuitive results. The top three most exposed occupations are Computer Programmers (75% task coverage), Customer Service Representatives (70%), and Data Entry Keyers (67%).
That range tells an important story. A highly paid technical role and a routine back-office function landing in the same exposure tier suggests AI is not simply automating the lowest-skill work first, but rather moving through tasks it can replicate, regardless of where those tasks sit on the pay scale.
The workers most affected by AI are not who most people picture. They are more likely to be older, female, more educated, and higher-paid — earning on average 47% more than workers with zero AI exposure. The exposed cohort is four times more likely to hold a graduate degree.
Theoretical Capability vs. Observed AI Usage by Occupational Category
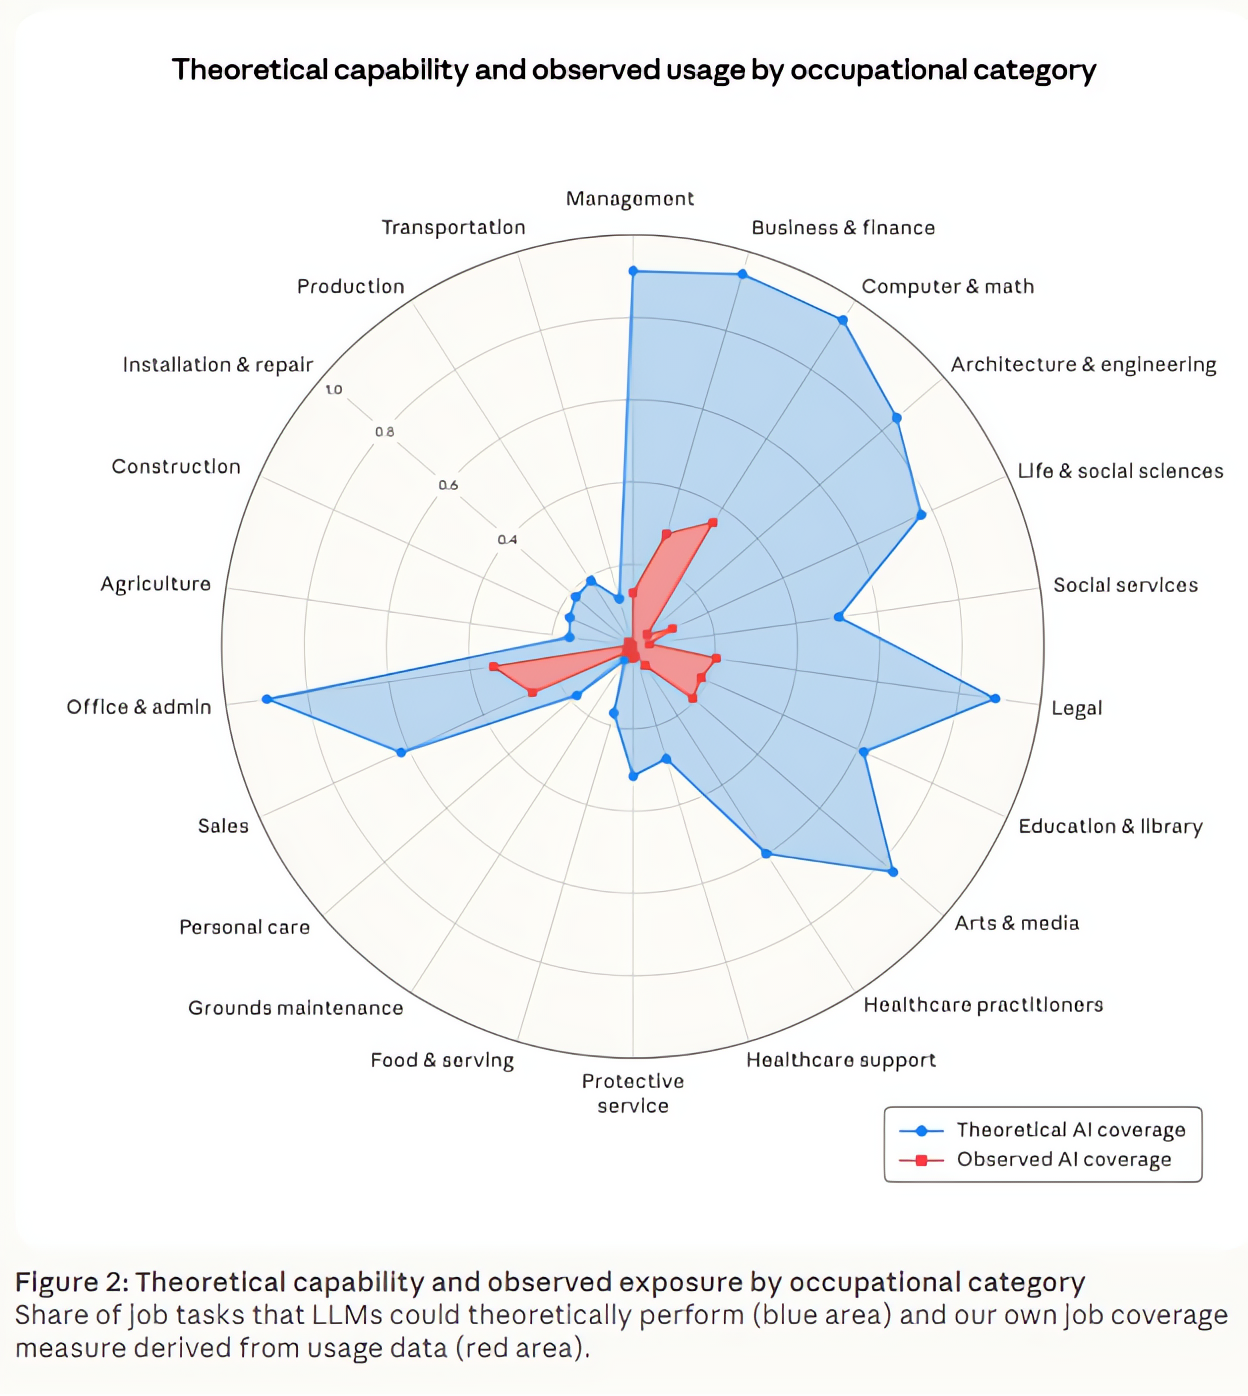
Source: Anthropic Economic Index — "Economic Primitives" (January 2026). Blue area = share of tasks LLMs could theoretically perform; red area = observed AI coverage derived from usage data.
This matters enormously for multifamily investors. The "at-risk renter" is not primarily a low-wage service worker. It is the educated, upper-middle-income knowledge worker — and that demographic does not just fill Class A buildings. It is the primary demand driver for Class B product across most of the country.
Augmentation vs. Automation: How AI Is Being Used
Not all AI use is created equal. The Anthropic data draws a critical distinction between augmentation and automation. On Claude.ai, augmentation leads at 52% of conversations versus 45% automation — most workers are using AI as a copilot, not a replacement. But the enterprise story is different. Among business API users, companies that have built AI directly into their workflows, automation is dominant. Businesses are systematically removing human steps from processes at a pace consumers aren't.
The implication is that the labor market disruption visible in consumer-facing AI data is likely understating what is already happening inside corporate workflows — and that unemployment numbers may lag actual displacement by months or years.
Section 2: Exposure Isn't the Whole Story — Introducing Adaptive Capacity
Knowing that a job is exposed to AI disruption does not tell you much about what happens to the person holding it. A Google engineer whose role gets partially automated has options. A 54-year-old administrative coordinator in a one-industry Midwestern city facing the same scenario has far fewer.
The Brookings Institution, in a January 2026 paper for the National Bureau of Economic Research, introduces the concept of "adaptive capacity" — a worker's ability to weather displacement and successfully transition to new work. It's a function of four variables: financial savings, age, the density of their local labor market, and the transferability of their skills.
When Brookings layered adaptive capacity onto AI exposure data, a more precise picture emerged. Of the 37.1 million workers in the top quartile of AI exposure, 26.5 million also have above-median adaptive capacity. These workers are exposed but resilient — they have savings, transferable skills, and local markets that offer alternatives. If displaced, most will find a path forward, perhaps with a period of dislocation, but not a freefall.
Then there's the other group.
Geographic Distribution of High Exposure & Low Adaptive Capacity Occupations
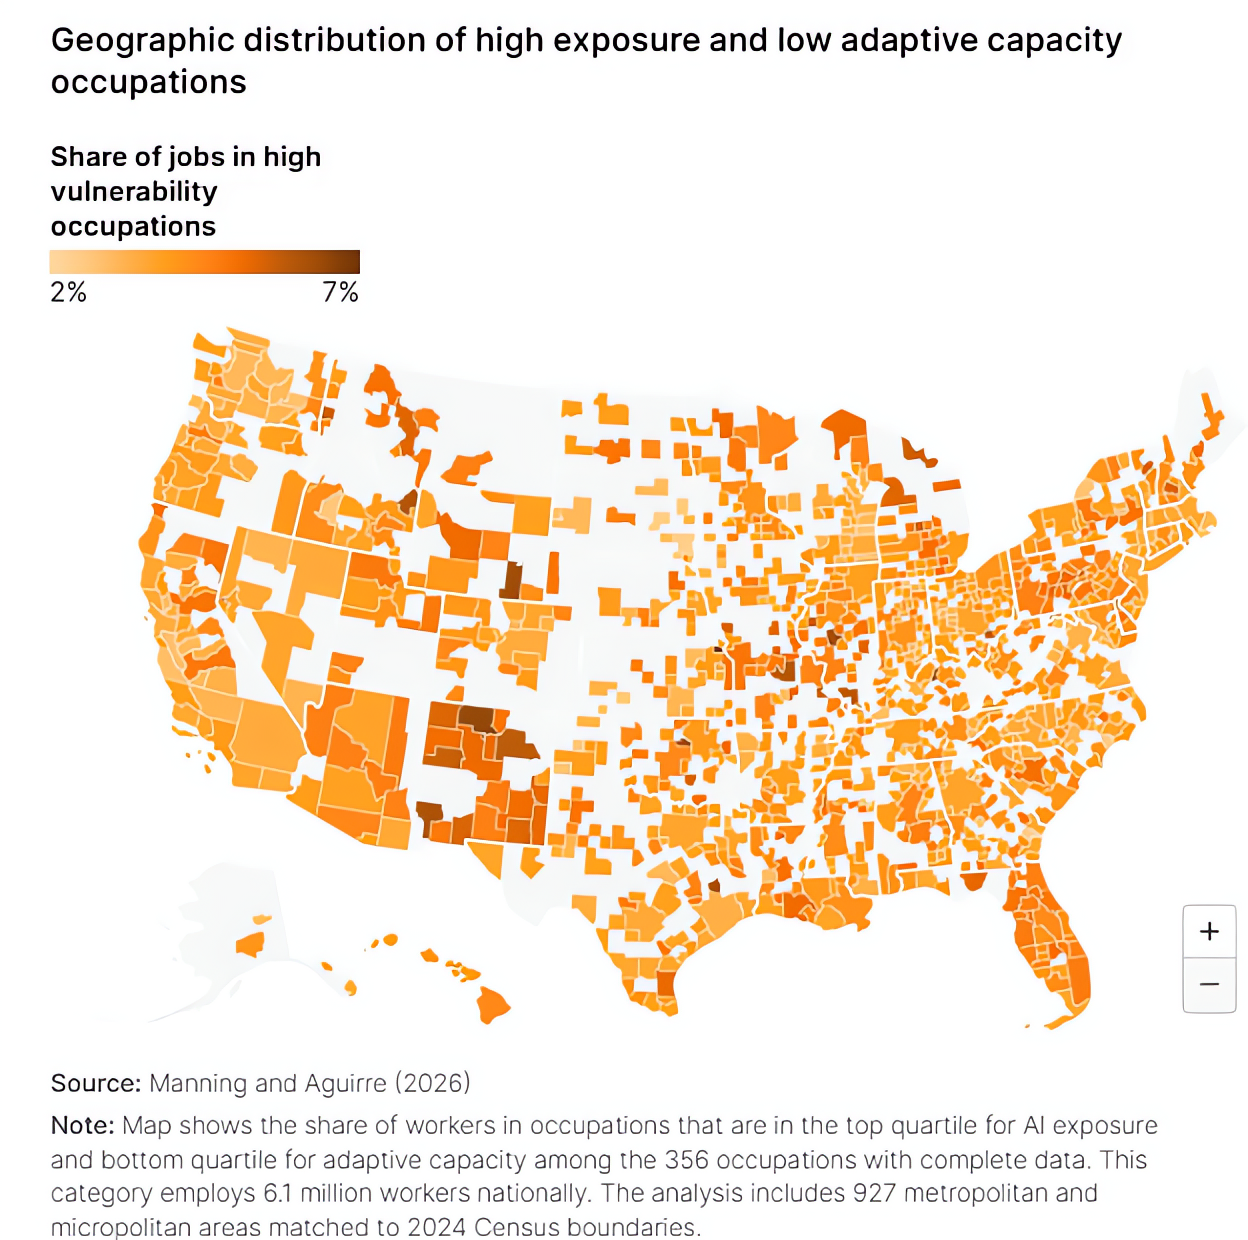
Source: Manning and Aguirre (2026) / Brookings Institution. Map shows share of workers in occupations in the top quartile for AI exposure and bottom quartile for adaptive capacity. 6.1 million workers nationally across 927 metro and micropolitan areas.
6.1 million workers — approximately 4.2% of the sampled U.S. workforce — face both high AI exposure and low adaptive capacity. These workers are concentrated in clerical and administrative roles. They tend to be older, with narrow skill sets that don't translate easily to other industries. They often lack meaningful financial savings. And critically, 86% of them are women.
For workers in this group, the road back tends to be longer. The adjustment typically involves some combination of retraining, relocation, or a period of lower income. In housing terms, that kind of pressure tends to show up not as a temporary gap in leasing activity but as a more permanent shift — whether that means moving to cheaper housing, sharing a unit, or leaving a market.
The Two-Variable Framework for Multifamily Investors
Thinking about exposure and adaptive capacity together gives investors a clearer picture than either measure alone. It reframes the underwriting question from whether a renter cohort faces AI risk to what they are likely to do if that risk materializes. Does demand compress, or does it just move?
Exposure × Adaptive Capacity Framework
- High exposure + high adaptive capacity: Demand shifts, not disappears. Renters may relocate to follow new opportunities, downgrade temporarily, or delay household formation — but they remain in the rental market. Think tech workers in San Francisco or financial analysts in New York.
- High exposure + low adaptive capacity: A job disruption tends to have a longer tail. Without much financial cushion, maintaining a current lease through a difficult transition is harder. Income drops, options narrow, and geography often becomes a constraint rather than a choice. The housing impact is less likely to be temporary and more likely to represent a genuine shift in what these renters can afford.
Section 3: The Geographic Map — Where Renter Demand Will Shift
The Anthropic Economic Index tracks Claude usage by state and metro, providing the clearest real-world map we have of where AI is already embedded in the workforce — and where it's headed.
Anthropic AI Usage Index (AUI) by State

Source: Anthropic Economic Index — "Uneven Geographic and Enterprise AI Adoption" (September 2025). AUI measures Claude adoption per capita, adjusted for workforce size. Baseline = 1.0. Washington D.C. leads at 4.0.
The High-AI-Adoption Tier: Gateway Cities
The Anthropic AI Usage Index (AUI) measures Claude adoption per capita, adjusted for workforce size. The top five U.S. states account for nearly 50% of all Claude usage despite representing only 38% of the working-age population. The District of Columbia leads the nation with an AUI of 4.0 — four times the baseline.
These are the markets where AI is most deeply embedded in professional workflows — with the nuance that they are also the markets with the highest adaptive capacity. The workers most exposed to AI in San Francisco, Seattle, Boston, and New York are also the workers best positioned to absorb disruption. These markets face transformation, not collapse.
The more immediate concern for Class A demand in these markets is the hiring slowdown at the entry level. Anthropic's labor market research finds a 14% decline in job entry rates for workers aged 22–25 in highly exposed occupations — a pattern that does not appear for workers over 25. The pipeline feeding gateway-city Class A apartments is thinning, even if current residents remain stable.
The Vulnerable Middle: Midsized Markets and College Towns
Where the Brookings research gets particularly relevant for real estate investors is the geography. The most vulnerable workers — those combining high AI exposure with low adaptive capacity — tend to be concentrated not in major coastal markets but in smaller metros, college towns, and state capitals, especially across the Mountain West and Midwest.
Think markets like Boise, Salt Lake City, Omaha, Columbus, and a range of midsized university cities. These markets have absorbed meaningful multifamily investment over the past decade on the back of population growth, relatively affordable land, and expanding administrative and knowledge-work employment bases. Many of those jobs — administrative coordinators, back-office processors — sit squarely in the AI crosshairs. And the workers holding them often lack the financial savings or skill mobility to adapt quickly.
What the Anthropic data also shows is that AI adoption is not staying concentrated on the coasts. Usage became considerably more evenly distributed across U.S. states over a relatively short window. For investors in Sun Belt and Midwest markets, it may be worth thinking about how administrative and clerical employment bases in those areas could look different in five to ten years than they do today.
The Near-Term Safe Haven: Physical-Economy Markets
At the other end of the spectrum, markets anchored in physical trades, logistics, construction, and services remain largely insulated from AI displacement in any near-term window. The Anthropic data is unambiguous: ground maintenance jobs have 3.9% observed AI exposure. Transportation sits at 12.1%. Construction and food services are at 16.9% each.
These jobs require physical presence and manual dexterity that current AI systems cannot replicate. The renters who hold these jobs are not facing near-term displacement. In fact, as AI-displaced workers from other sectors seek more affordable housing, these markets may see a demand tailwind.
| Market Tier | Example Markets | Investor Read |
|---|---|---|
| High Exposure / High Resilience SF, NYC, Seattle, DC, Boston, Austin | Tech, finance, government knowledge workers | Transformation, not collapse. Monitor entry-level hiring; watch for demand softening in the 22–30 age cohort. |
| High Exposure / Low Resilience Boise, Salt Lake City, Omaha, Columbus, college towns | Administrative, clerical, back-office workers | Most direct demand risk for Class B multifamily. Revisit underwriting assumptions on admin-heavy employment bases. |
| Low Exposure / Physical Economy Logistics corridors, Sun Belt trades-heavy markets | Construction, trades, transportation, services | Near-term demand durability. Potential upside from displaced workers trading down into workforce housing. |
Section 4: What This Means for Class A, B, and C
In Part 1 of this series, we introduced the barbell economy thesis: AI would hollow out the middle-income renter cohort, leaving high earners and low-wage essential workers relatively unscathed while clerical and administrative workers faced the most immediate disruption. The new data refines that picture — and in some cases flips it.
Class A
More Vulnerable Than Assumed
Class B
Where the Real Risk Lives
Class C / Workforce
The Durable Bet
For every 10-percentage point increase in AI task coverage, the Bureau of Labor Statistics projects employment growth drops by 0.6 percentage points through 2034. That's a slow bleed, not a sudden drop — which makes it easy to underweight in a standard underwriting model. The Class B question we posed in Part 1 — will it get repositioned up, pulled down, or caught in the middle — gets a sharper answer with this data. In markets where the underlying employer base is heavily weighted toward administrative and clerical work, the pull-down scenario is the most likely outcome.
The Investor Takeaway: Geography Is the New Underwriting Variable
The AI-and-real-estate conversation has too often relied on a simple chain of assumptions: AI will hurt jobs, jobs drive housing demand, therefore AI will hurt housing — without examining where, for whom, or how fast. The data tells a more useful story.
Disruption is real, directional, and measurable. But it is profoundly uneven, by occupation, income level, geography, and workers' ability to adapt. The investors who navigate this well are not the ones who panic at the headlines or dismiss the risk entirely. They're the ones who build a more precise picture of the renter cohort they're underwriting.
- Add workforce composition to your market analysis. A market's mix of knowledge workers vs. physical-economy workers is now a leading indicator of demand durability — more so than aggregate job growth numbers.
- Watch the Anthropic Economic Index. It updates quarterly with state-level AI adoption data. A market's movement on the AUI is an early signal of the workforce transformation coming to its renter base.
- Track entry-level hiring in gateway cities. The 14% slowdown in 22–25 year-old hiring in exposed occupations is the most actionable near-term signal for Class A demand. It precedes the vacancy data by 12–24 months.
- Stress-test Class B assumptions in secondary markets. If a market's employment base is disproportionately administrative or clerical, run your models with a 10–15% demand reduction scenario.
The AI economy is not an abstraction anymore. It's in the employment data, it's in the usage statistics, and it's working its way into the rental market. The investors who treat it as a knowable, measurable risk — rather than an unknowable macro force — will be the ones best positioned for what comes next.
Sources
- Anthropic Economic Index — "Economic Primitives" (January 2026)
- Anthropic Economic Index — "Uneven Geographic and Enterprise AI Adoption" (September 2025)
- Anthropic Economic Index — "Labor Market Impacts of AI: A New Measure and Early Evidence" (March 2026)
- Brookings Institution / NBER — "Measuring US Workers' Capacity to Adapt to AI-Driven Job Displacement" (January 2026)
- U.S. Bureau of Labor Statistics — Employment Projections 2024–2034
This blog is for informational purposes only and does not constitute investment advice.