average rent
average occupancy rate
ANNUAL sales volume
YoY rent change
yoy occupancy change
individual transactions
QUARTERLY DEMAND
YTD: -146
QUARTERLY COMPLETIONS
YTD: 138


Average Monthly Mortgage Payment
Average Monthly Rent
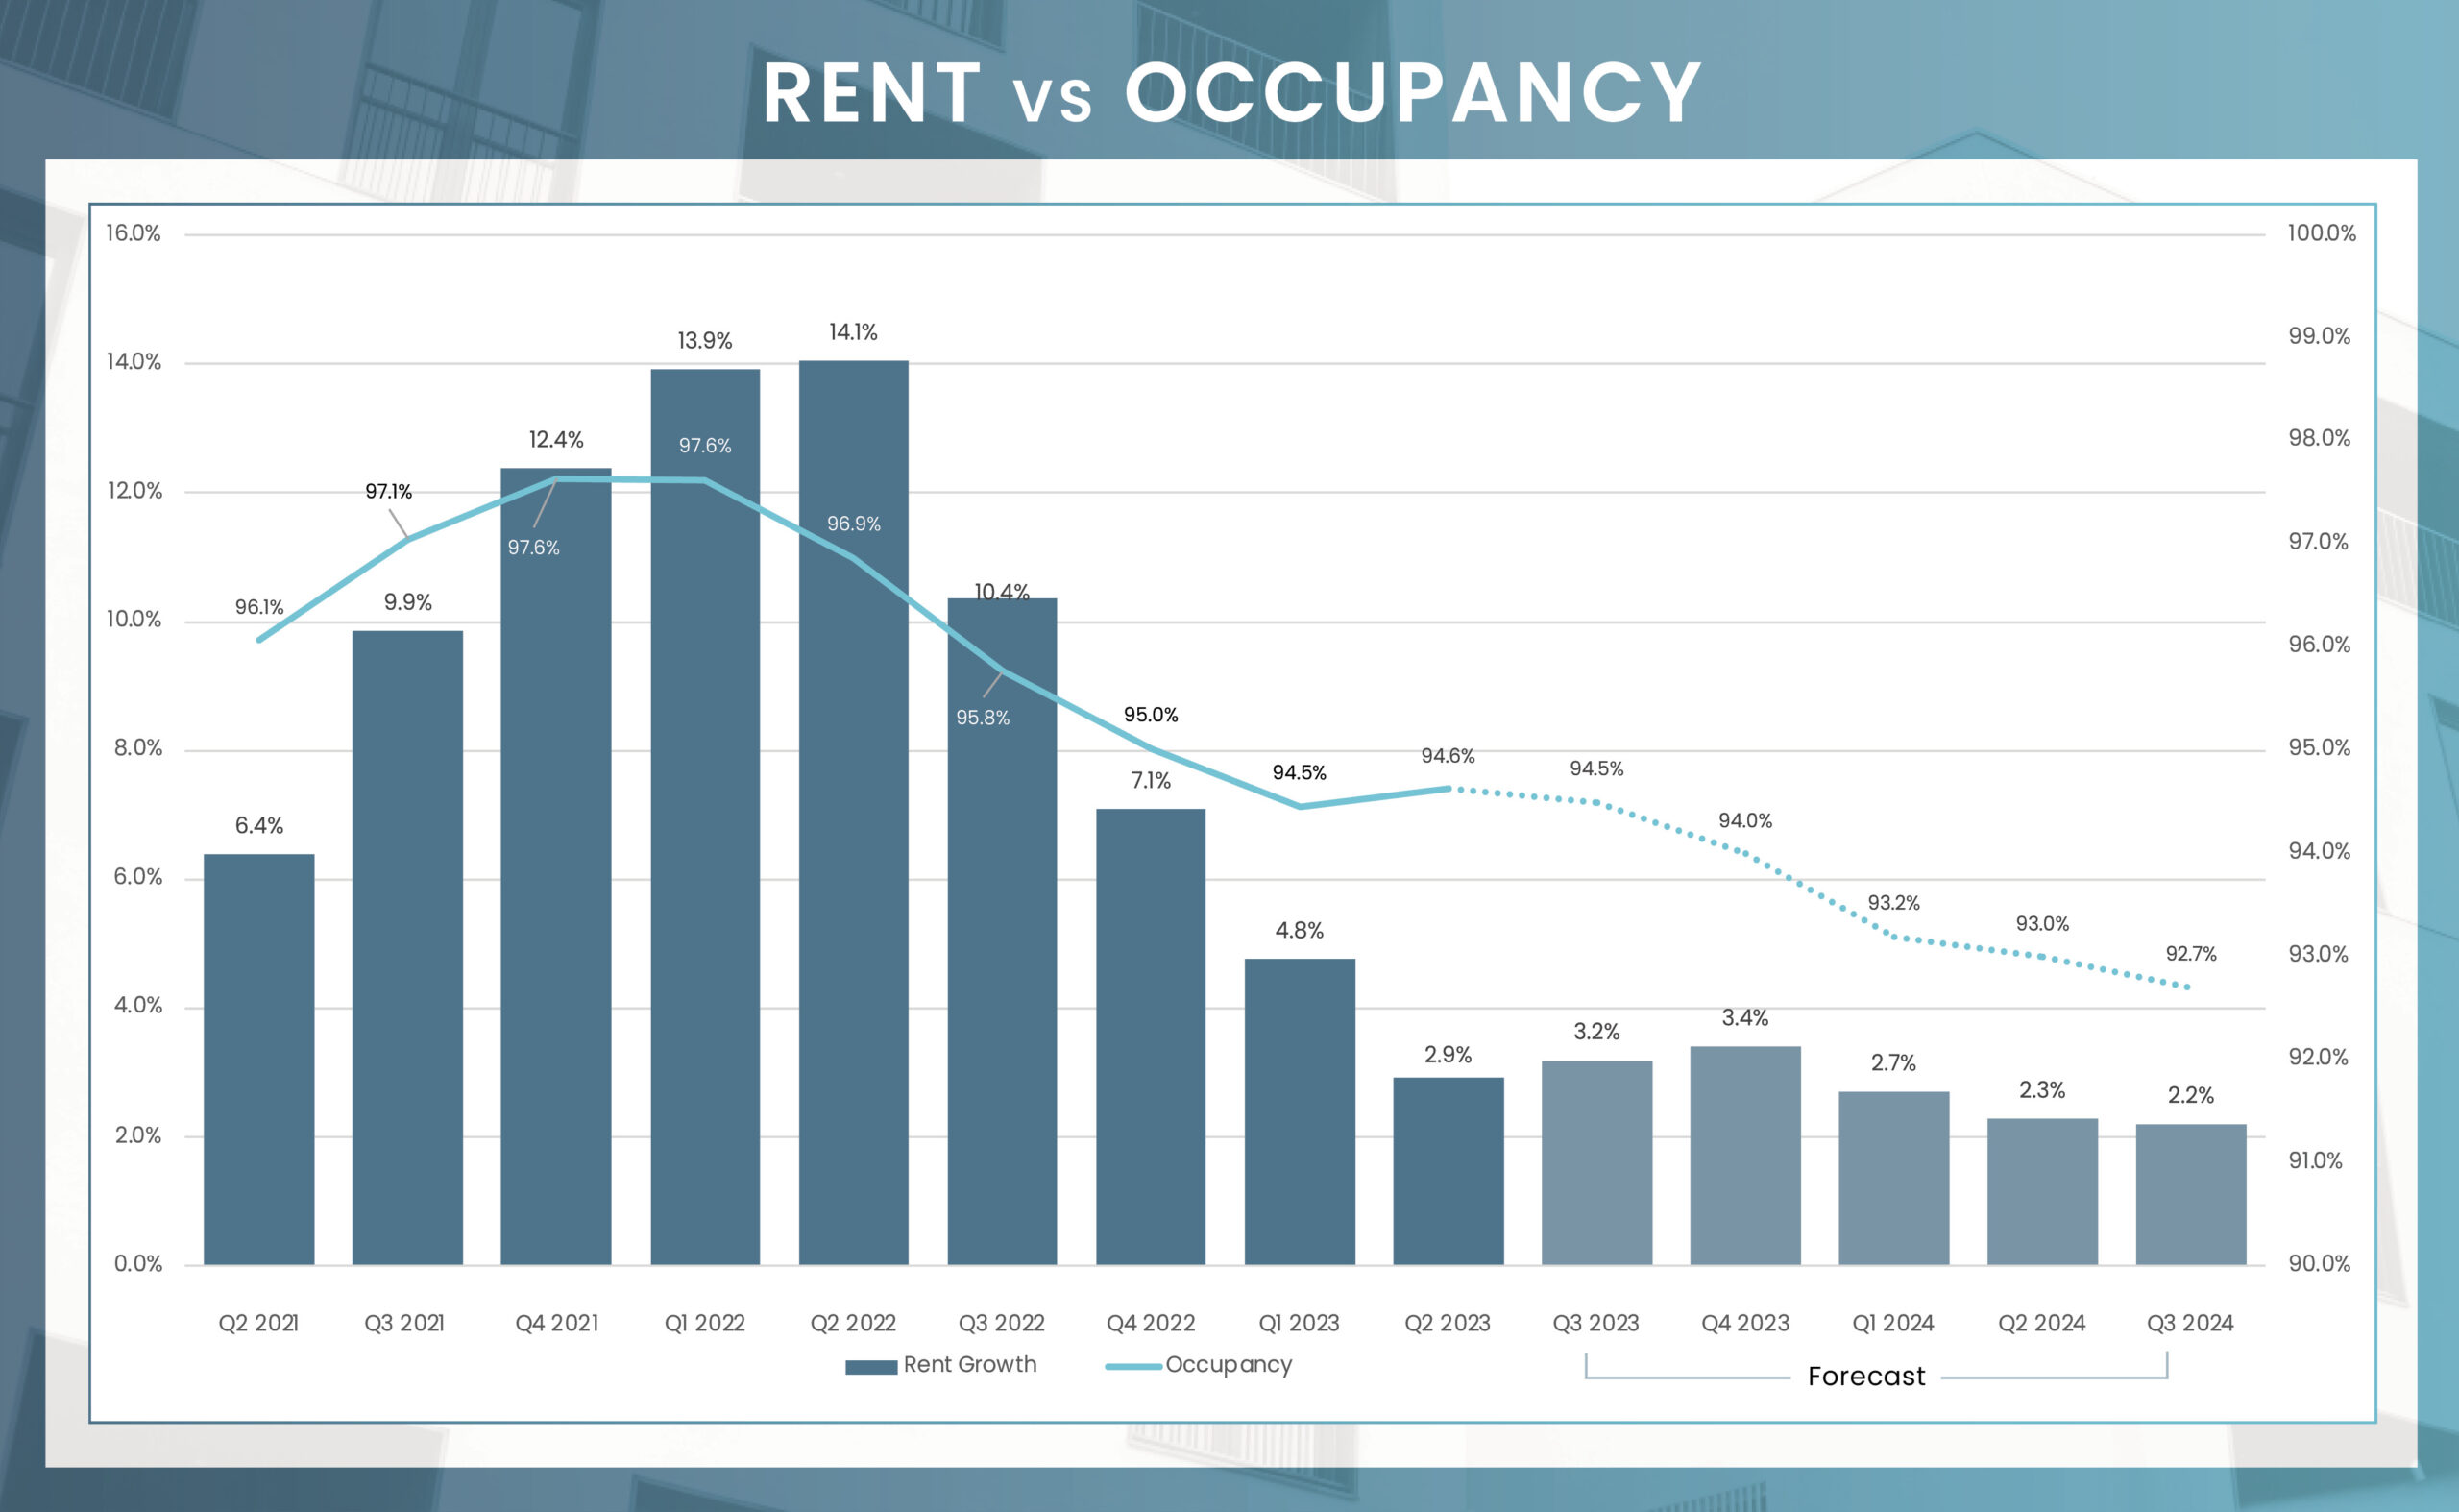
Historically known for its robust occupancy rates averaging 95.6% over the last five years, the Tulsa metropolitan apartment market saw a year-over-year decline of 220 basis points in Q2 2023, bringing the current average occupancy rate to 94.6%. However, this was offset by a quarter-over-quarter improvement of 20 basis points. Among multifamily classes, Class B units led with the highest occupancy level at 95.5%, followed by Class C and Class A units at 93.7% and 93.6% respectively. On a submarket level, North Tulsa demonstrated the strongest occupancy performance at 97.0%, while Central Tulsa lagged with an occupancy rate of 93.8%.
Average effective rent growth in the Tulsa apartment market has mirrored the national trend, moderating from its peak gains in the previous year. In Q2 2023, rents for new leases grew by 2.9% year-over-year, falling below the market’s five-year average of 5.9%. This is in line with current trends in most southern and sub belt markets. With an average monthly rental rate of $958, Tulsa offers more affordable rents compared to its regional counterparts.
In terms of product classes, Class A units, which had previously shown strong rent performance, experienced slower annual effective rent growth of 0.8% in the most recent quarter. Meanwhile, Class C units led with a brisk 4.9% annual growth rate, and Class B units followed with 3.0% growth. This suggests that some Tulsa residents might be choosing more cost-effective rental options in the current economic climate.
| Submarket | Average Occupancy | Annual Occupancy Change | Average Monthly Rent | Annual Rent Change |
|---|---|---|---|---|
| Central Tulsa | 93.8% | -2.0% | $885 | 3.3% |
| East Tulsa | 94.4% | -2.6% | $806 | 6.2% |
| North Tulsa | 97.0% | -1.7% | $1,054 | 7.9% |
| South Tulsa/Broken Arrow | 94.9% | -2.2% | $1,049 | 0.7% |
| West Tulsa | 94.8% | -2.5% | $1,055 | 3.9% |
| Tulsa, OK | 94.6% | -2.2% | $958 | 2.9% |
Units Under Construction
Units UC Delivering In the Next 4 Quarters
The Tulsa apartment market kicked off the year with more subdued transaction activity. Over the past four quarters, 10 properties changed hands, resulting in a trade volume of $273.0 million, as reported by Real Capital Analytics. This figure represents a year-on-year decrease of 53%. Interestingly, the majority of the annual volume was loaded in the third quarter of 2022, which influenced per unit pricing. The rolling 12-month average price per unit (PPU) measured $139,200 in the second quarter, reflecting an increase of 38% over the previous year’s average PPU. Despite the likelihood that transaction activity may not reach the levels observed in the previous year, Tulsa continues to be attractive to investors. The combination of the market’s relative affordability and solid economic foundation makes it a promising prospect for those seeking investment opportunities.
* Trailing 4Q average PPU
* Preliminary Data from RCA – Individual transaction $2.5M +
In May 2023, the Tulsa area realized a net gain of 8,600 jobs from May 2022, representing a 1.9% increase in employment. Consequently, the unemployment rate dropped by 20 basis points compared to the previous year, reaching 2.9%. This rate is significantly lower than the national benchmark of 3.4%. The mining and logging sector witnessed the most substantial job gains, with an addition of 3,100 positions, reflecting a 6.8% expansion. Additionally, the education and health services industry experienced the greatest sector expansion at 7.7%, with 1,900 jobs added.
May Annual Jobs Created
May 23 Employment growth
May 23 Unemployment rate
3.4% us may rate
Change from May 2022 to May 2023:
3,100
Percent Change:
6.8%
Change from May 2022 to May 2023:
1,900
Percent Change:
7.7%
Change from May 2022 to May 2023:
1,600
Percent Change:
2.5%
Change from May 2022 to May 2023:
1,400
Percent Change:
3.0%
Change from May 2022 to May 2023:
500
Percent Change:
2.5%
| Sector | Change from May 2022 to May 2023 | Percent Change |
|---|---|---|
| Mining and logging | 3,100 | 6.8% |
| Education and health services | 1,900 | 7.7% |
| Manufacturing | 1,600 | 2.5% |
| Trade, transportation, and utilities | 1,400 | 3.0% |
| Information | 500 | 2.5% |
| Financial activities | 400 | 0.7% |
| Professional and business services | 100 | 2.8% |
| Other services | 100 | 0.4% |
| Government | 100 | 0.1% |
| Construction | (200) | -3.6% |
| Leisure and hospitality | (400) | -0.5% |


Despite a national slowdown, the Tulsa market continues to attract strong investor interest. Presently, 1,102 housing units are under construction, and approximately 981 units are slated for completion within the next four quarters. Of Tulsa’s five submarkets, only three—led by Central Tulsa with 554 new units expected to come online—will see new deliveries in the upcoming year. While there may be temporary impacts to rent growth and occupancy rates, these are not cause for significant concern as the market is expected to normalize over the coming years. The long-term outlook for Tulsa remains positive, bolstered by a stable economy, controlled construction growth, and favorable employment trends. These factors are expected to sustain demand and enhance the market’s resilience against potential challenges.