$1,170 4Q 2023
$1,222 4Q 2024
4.4%
91.1% 4Q 2023
90.8% 4Q 2024
-30 POINTS
1.43M 2023
1.44M 2024
3.1% 2023
4.5% 2024
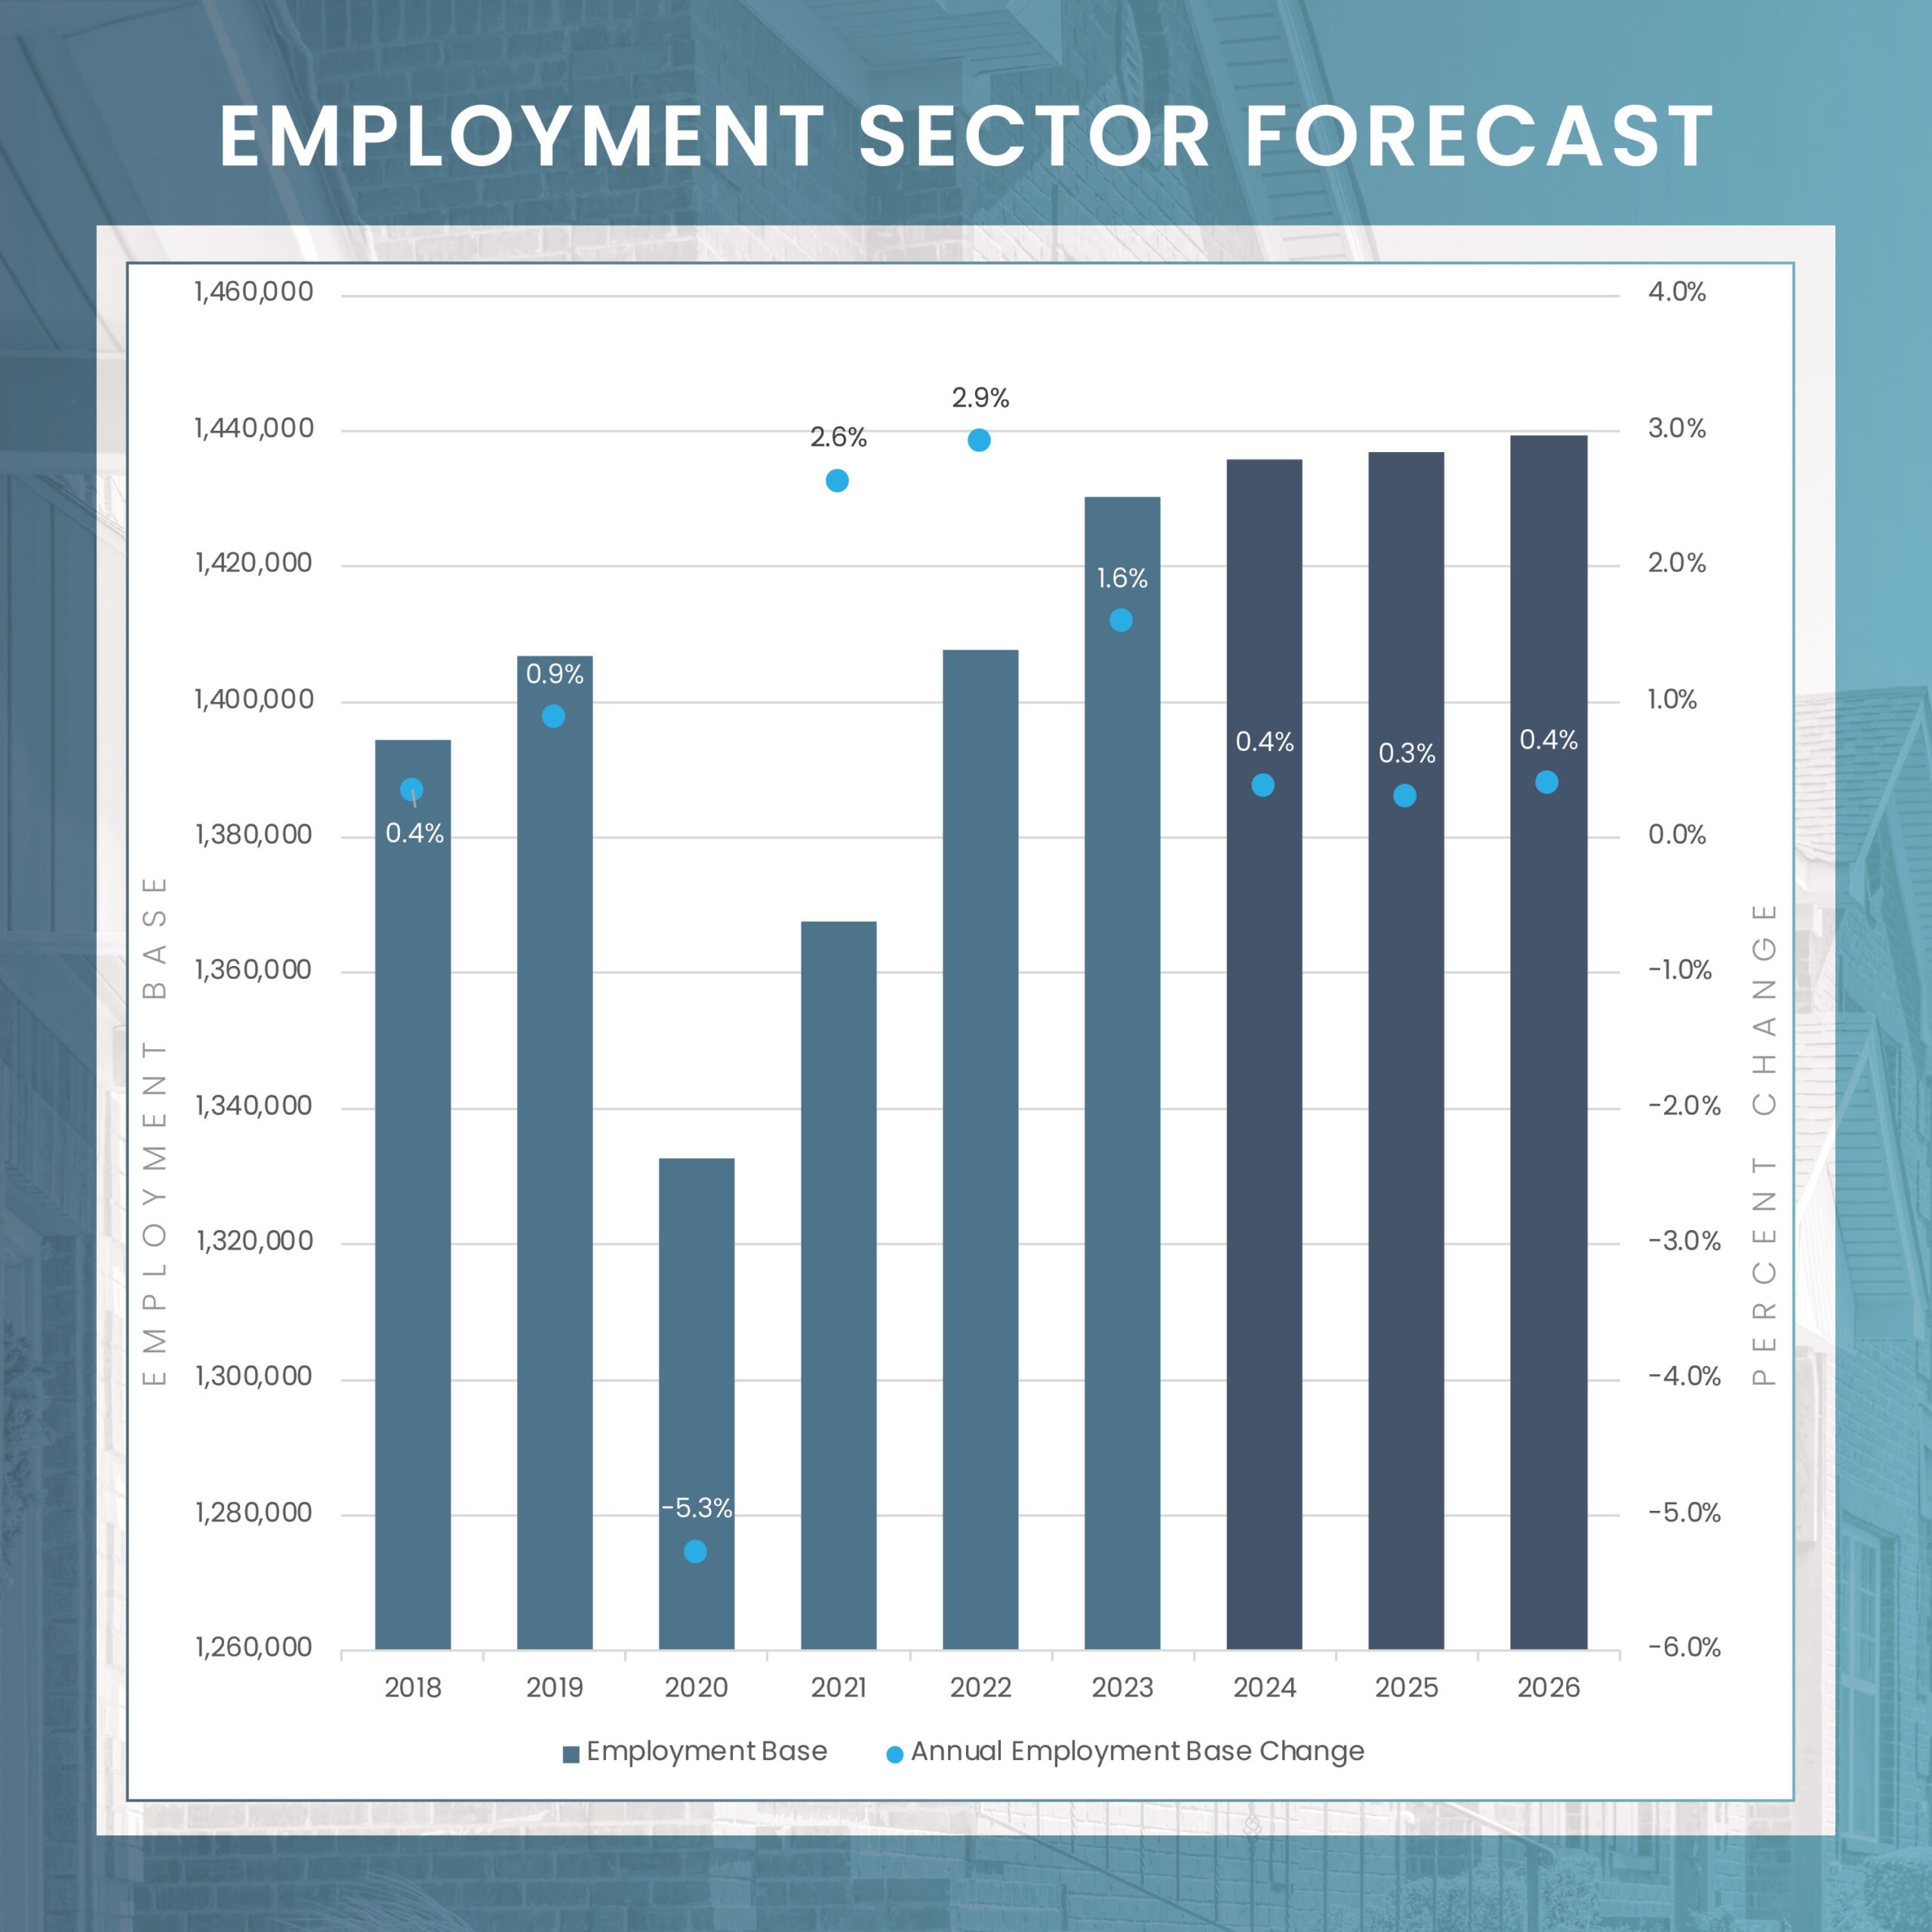
* Please note that these employment figures have been adjusted for seasonal variations and are based on Moody’s Analytics forecast as of January 1, 2024.
** Please note that these unemployment rates are estimates that have not been adjusted for seasonal variations, and they are derived from Moody’s Analytics forecast as of January 1, 2024.
FORECASTED ABSORPTION
FORECASTED NEW SUPPLY
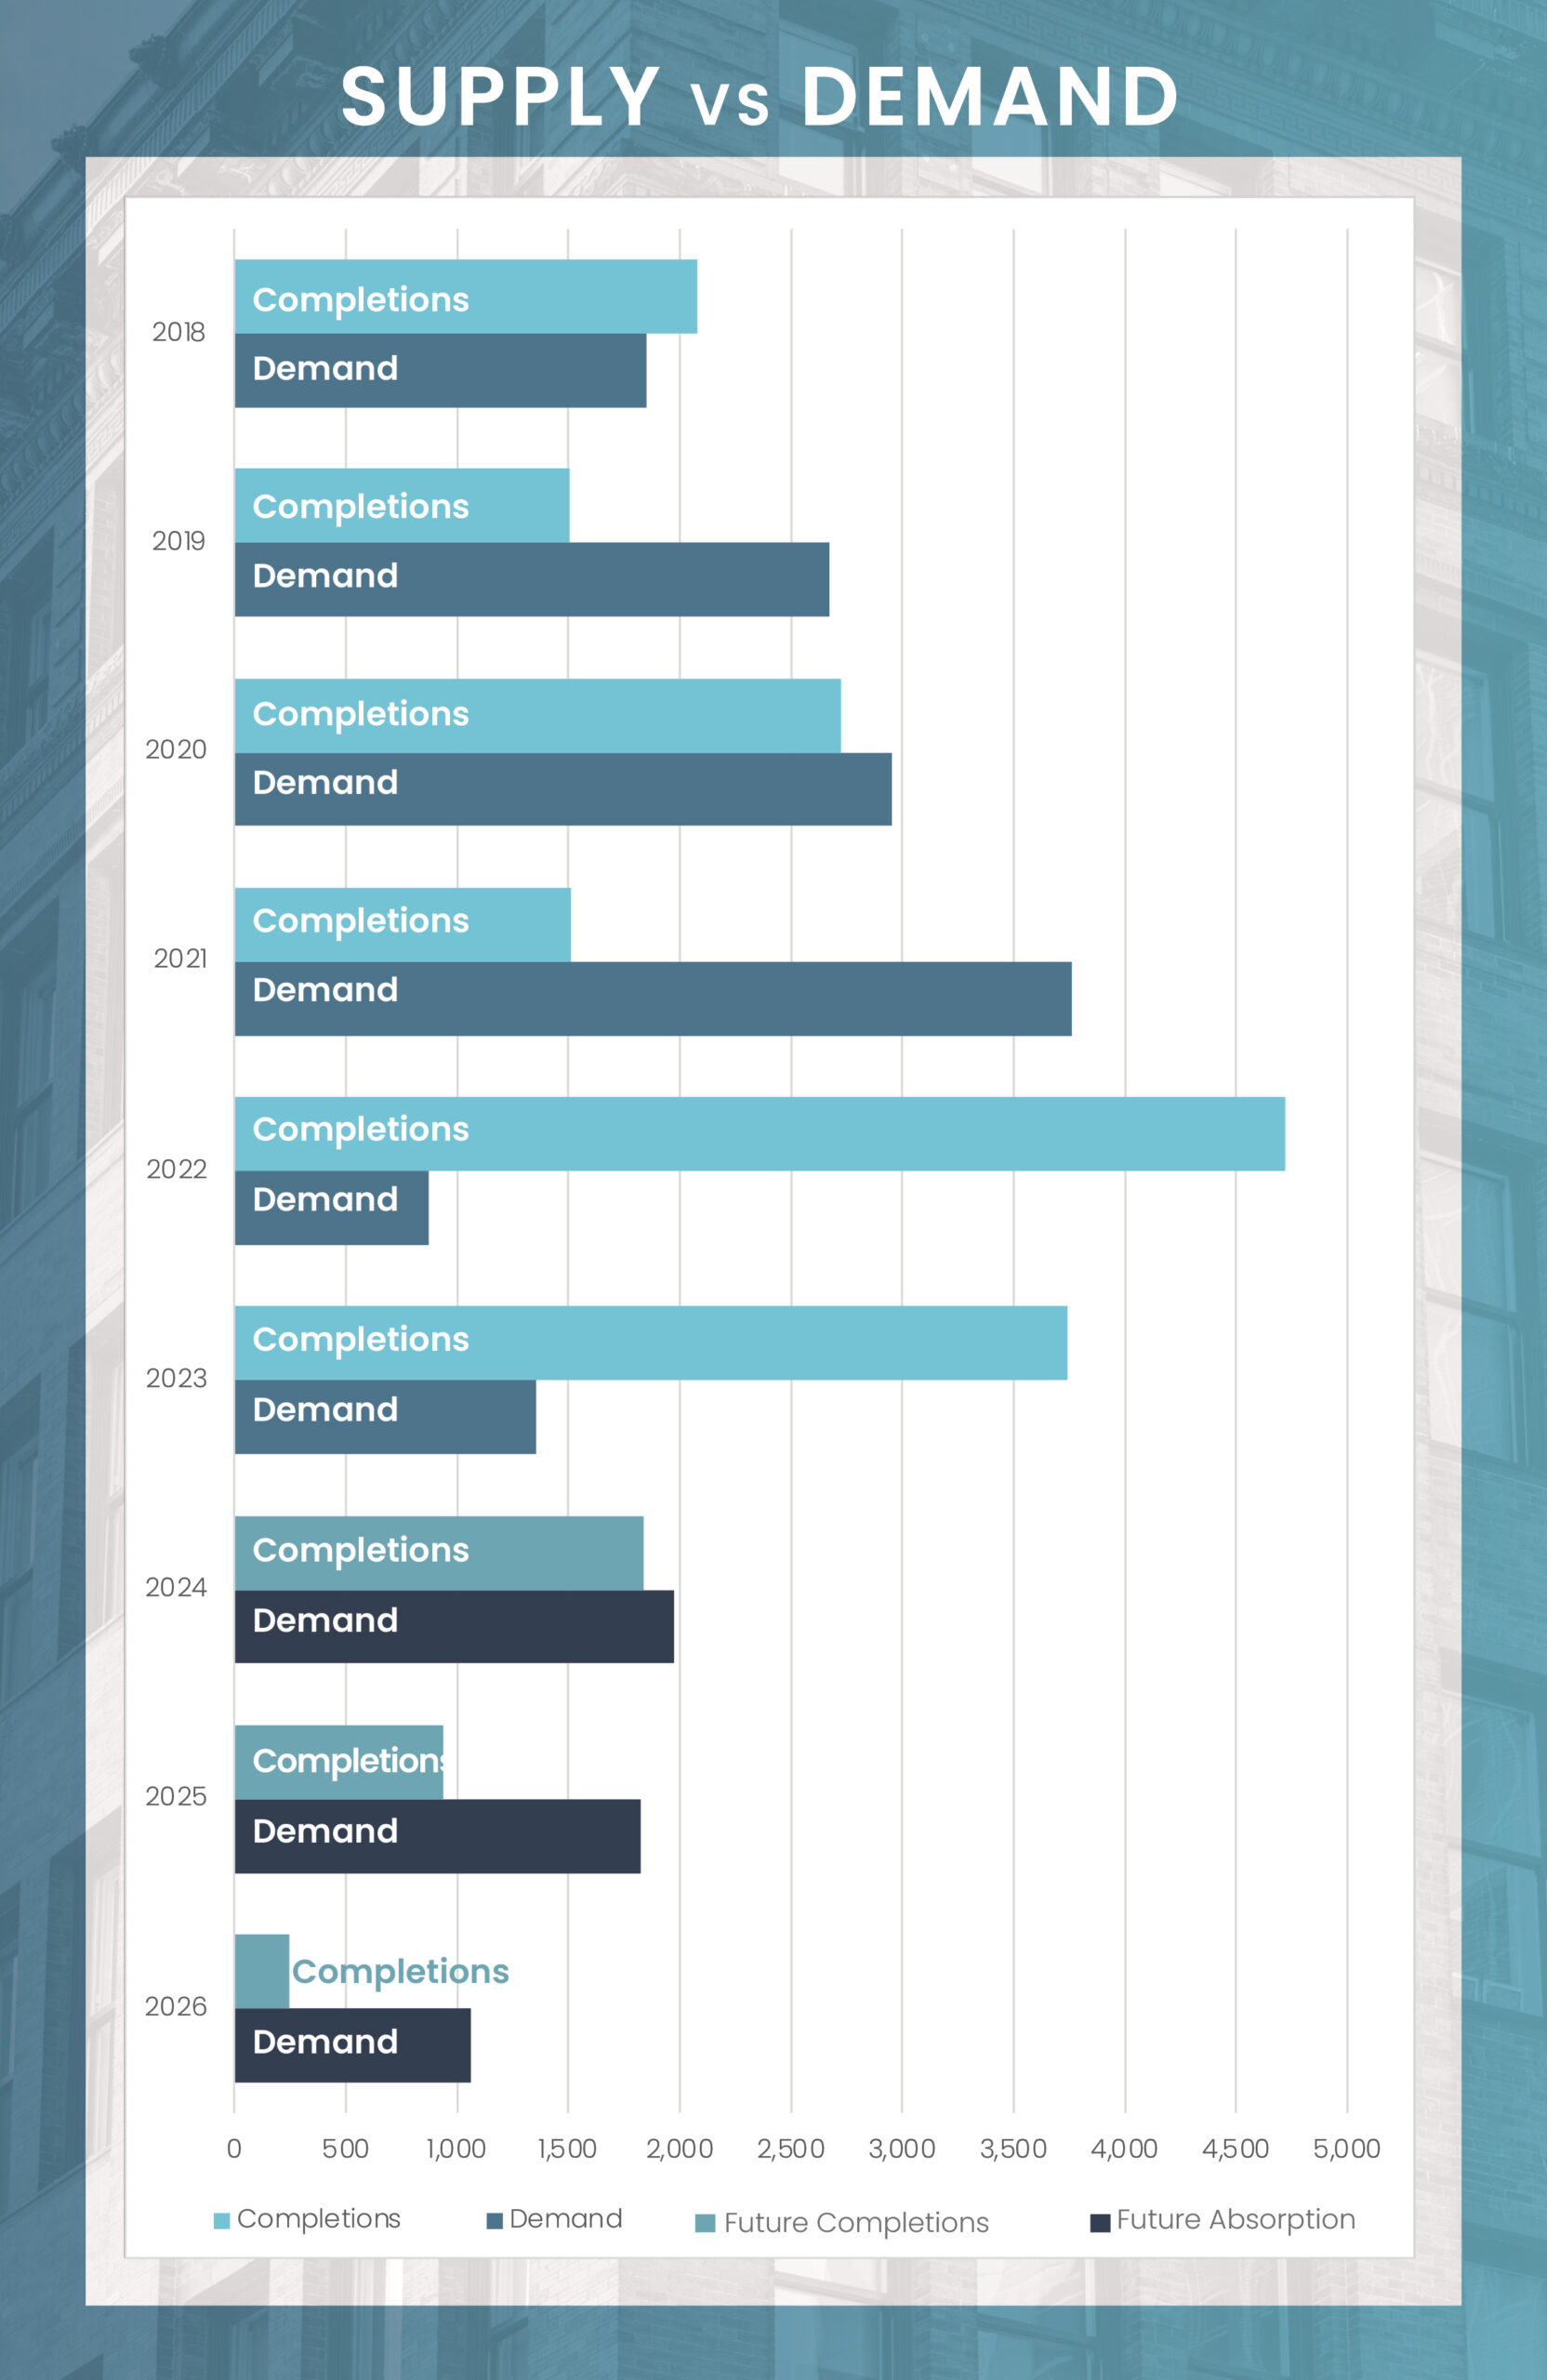
In 2024, expect Saint Louis to break from the trend of new apartment supply exceeding renter demand. Unlike many markets facing consecutive years of increased deliveries, St. Louis is set to see a decline in the influx of new apartments. After adding 8,400 units in 2022 and 2023, a more manageable 1,839 units are projected for delivery in 2024. This reduction significantly lowers the risk of oversupply, with deliveries forecasted to be more than half below the levels recorded in 2023 as we move into 2024.
The main challenge for Saint Louis lies in addressing the surplus units from 2023, particularly those introduced towards the year’s end. While net absorption is expected to surpass deliveries in 2024, the excess from 2023 will temporarily affect market fundamentals, particularly occupancy rates. A slight decrease is anticipated, with occupancy rates hovering around 90.8% in the first half of the year and stabilizing thereafter. However, a turnaround is expected in 2025 and 2026, as occupancy growth gains momentum and operators successfully fill the remaining excess units.
With 3,000 units currently under construction, St. Louis’ development pipeline remains slightly above its long-term average of 2,200 units, yet it has seen a considerable reduction from the levels of 2022 and 2023. Moreover, there has been a rapid decline in new construction starts across the metro area. In 2023, only 975 units began construction, marking the lowest figure since 2019.
The majority of these units in development are largely located in the Downtown St. Louis, Mid County, and St. Charles submarkets. Together, they contribute to over 70% of the units currently in the development phase. In the upcoming four quarters, both the Downtown St. Louis and Mid County submarkets are expected to add an additional 600-plus units to their inventory each. While construction and financing costs have surged recently, savvy developers might find opportunity by persisting through these challenges. By going against the current trend and capitalizing on the market’s shift back towards demand outpacing supply, they could potentially reap significant rewards, as experienced real estate investors often suggest that contrary strategies yield the greatest benefits.
Average Monthly Mortgage Payment
Average Monthly Rent
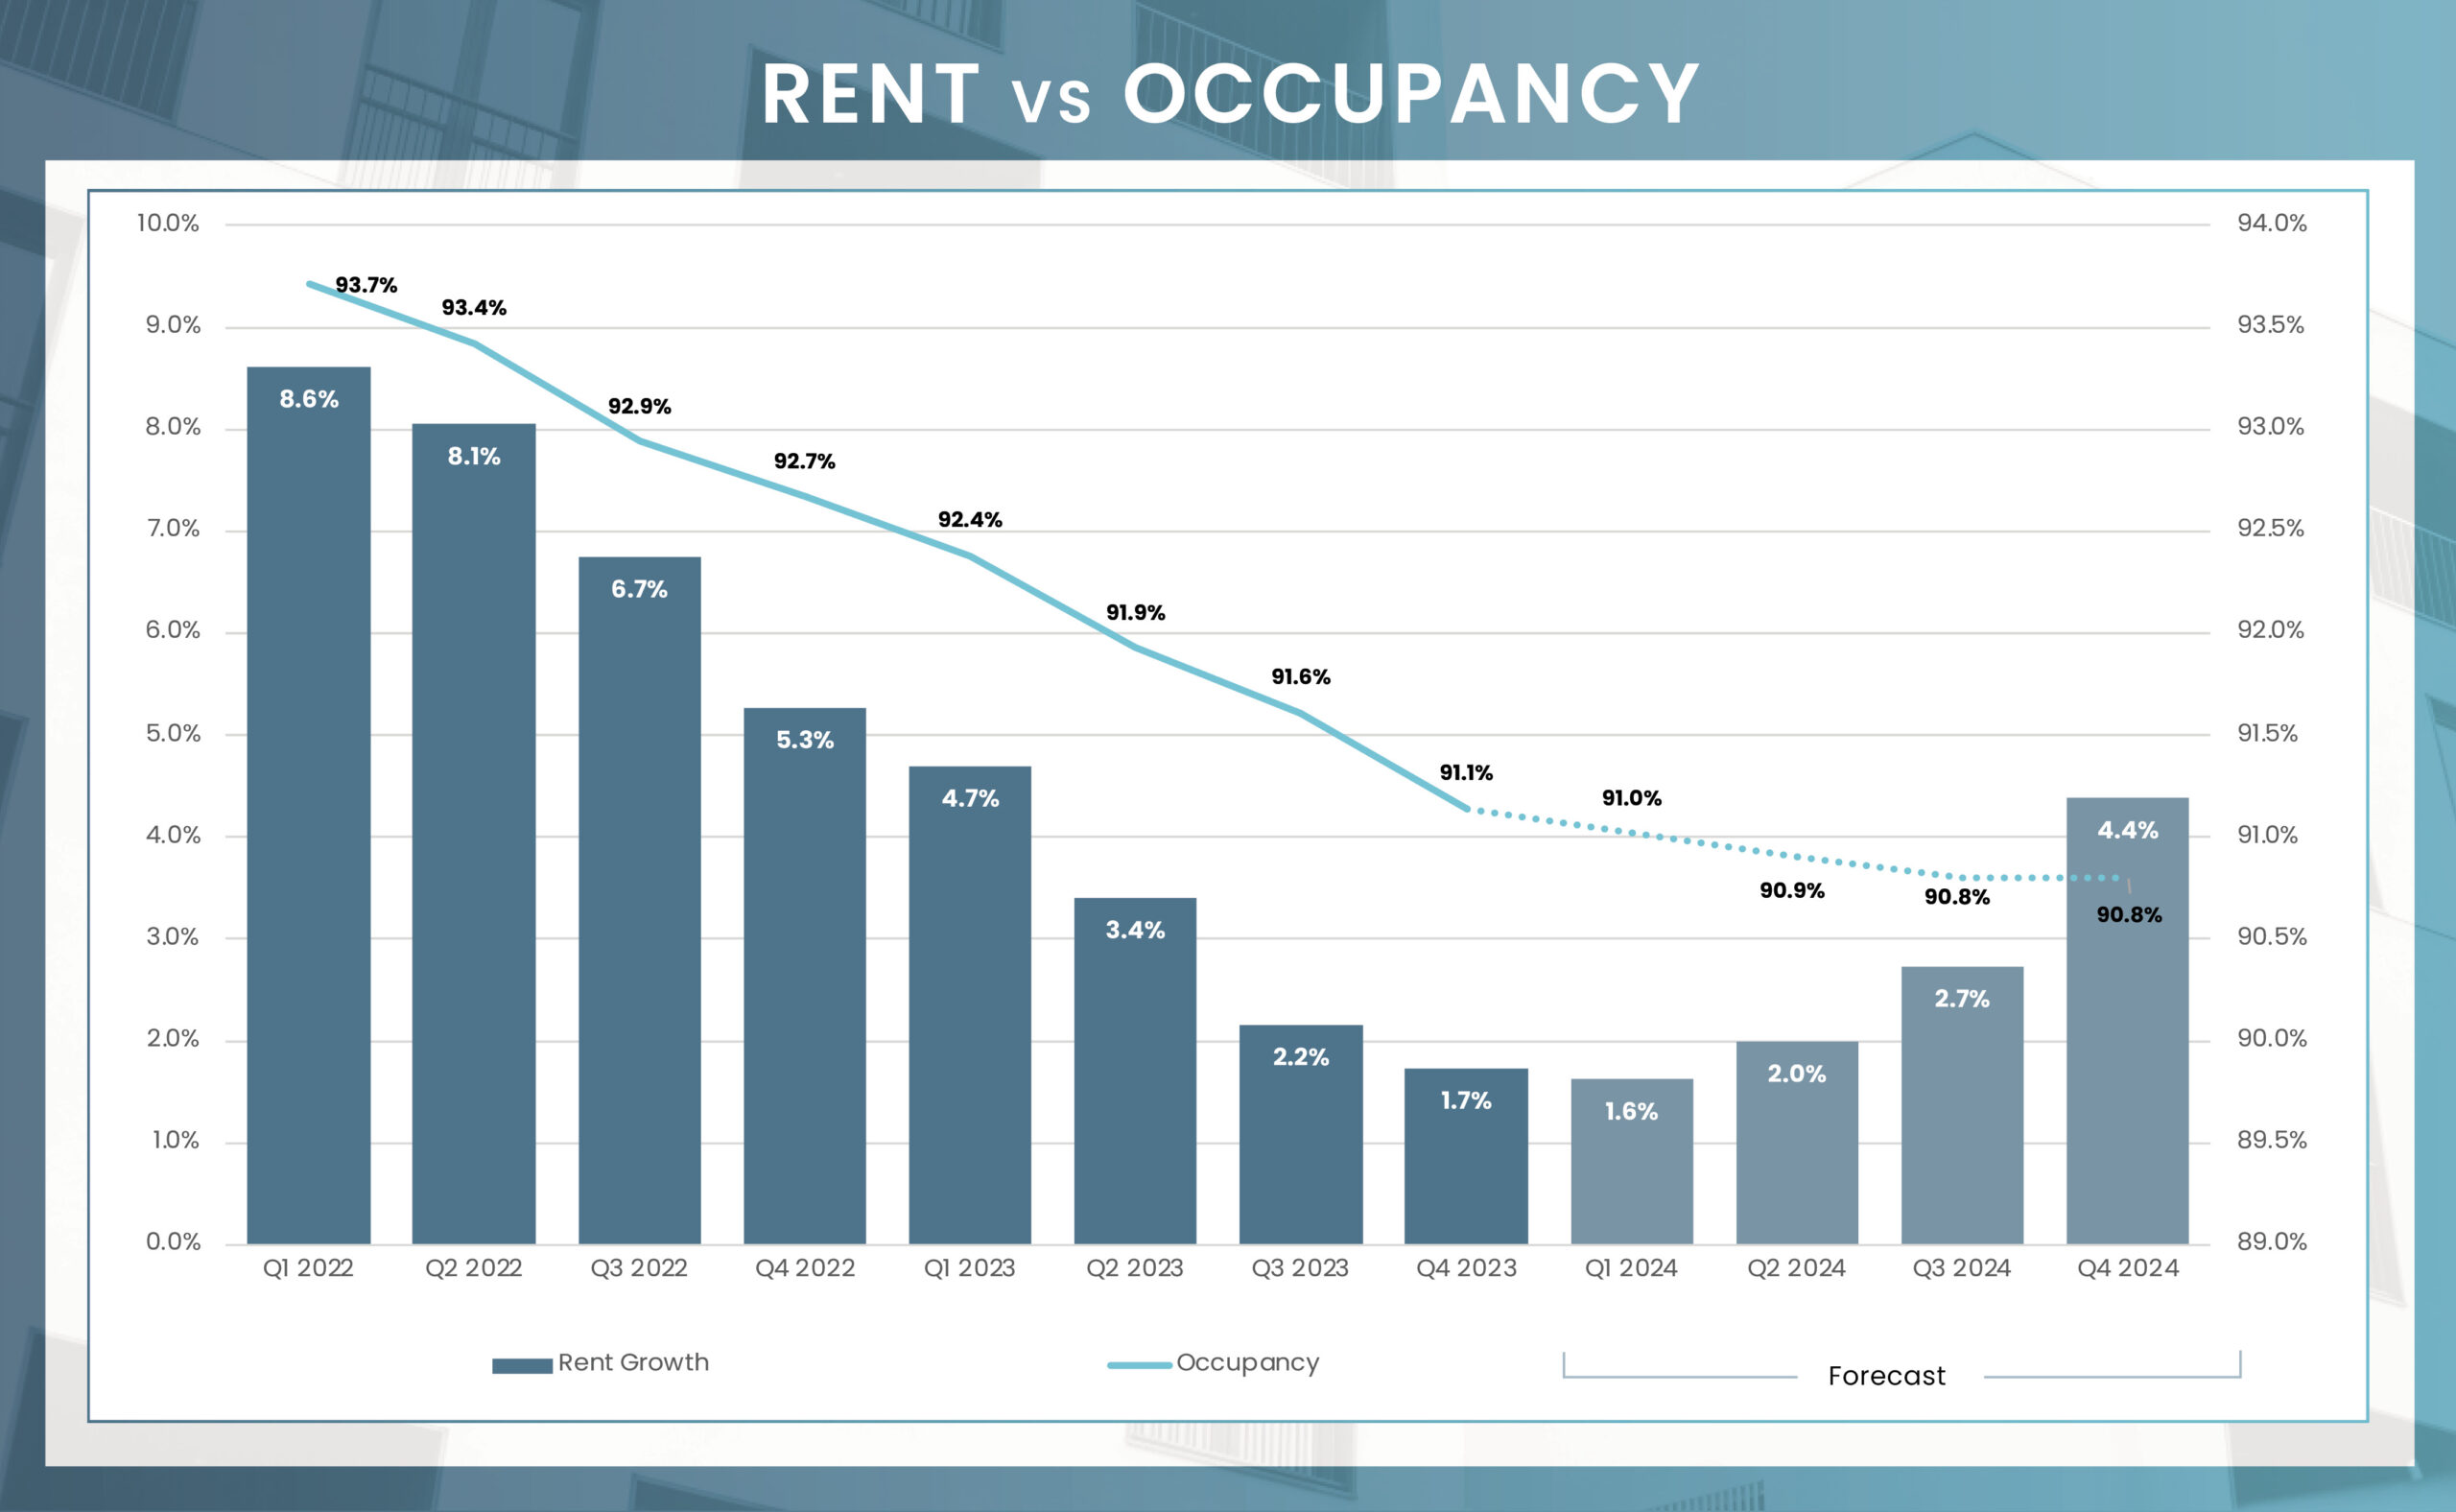
At the close of 2023, St. Louis recorded annual rent growth of 1.7%, a decline from the 4.7% rate seen a year prior. This was largely due to increased vacancies following new market supply. However, this growth still surpasses the national average of 0.9%. The Class A segment, growing only by 0.3% over the past year, significantly contributed to this overall slowdown. With 1,900 units scheduled for delivery in 2024, further pressure on rents in this segment is likely. Meanwhile, rent growth in the more affordable Class B and C segments fared much better recording an annual increase of 3.4%.
For the first half of 2024, St. Louis is expected to witness annual rent growth remaining below 3%. However, a rise to just above 4% is forecasted for the second half of the year as occupancy levels stabilize and the market adjusts to the influx of new units. On a submarket level, Metro East, with a total inventory of 14,000 units and no new completions scheduled, did not experience the development surge seen in other regions. Consequently, it is predicted to outperform the broader metro with a 4.9% rent increase by the fourth quarter of 2024, compared to the overall market’s projected 4.4% rise. On the contrary, the Downtown St. Louis submarket, which hosts about 24% of the units under construction, is expected to lag behind the metro average, with a projected growth of 3.8% by the fourth quarter of 2024. However, in the present market context, it’s a rate that numerous multifamily investors would be delighted to attain in the current economic climate.
| Submarket | Q4 2023 Stabilized Occupancy | Q4 2024 Stabilized Occupancy (f) | Annual Occupancy Change (2024/2023) | Q4 2023 Average Monthly Rent | Q4 2024 Average Monthly Rent (f) | Annual Rent Change (2024/2023) |
|---|---|---|---|---|---|---|
| Clinton County | 96.3% | 96.1% | -0.2% | $796 | $838 | 5.3% |
| Crawford County | 96.6% | 96.3% | -0.2% | $663 | $697 | 5.1% |
| Franklin County | 97.9% | 97.8% | -0.2% | $800 | $841 | 5.0% |
| Lincoln County | 94.3% | 94.1% | -0.3% | $916 | $961 | 4.9% |
| Outlying Madison County | 96.1% | 96.0% | -0.2% | $850 | $892 | 4.9% |
| Bond County | 93.2% | 92.4% | -0.8% | $673 | $706 | 4.9% |
| Metro East | 94.2% | 93.9% | -0.2% | $1,102 | $1,156 | 4.9% |
| Jefferson County | 95.1% | 94.9% | -0.2% | $1,077 | $1,128 | 4.8% |
| South County | 94.4% | 94.2% | -0.2% | $996 | $1,044 | 4.8% |
| Jersey County | 91.7% | 91.3% | -0.5% | $407 | $426 | 4.8% |
| Warren County | 96.8% | 96.5% | -0.2% | $1,053 | $1,103 | 4.7% |
| Macoupin County | 90.9% | 90.4% | -0.5% | $505 | $528 | 4.7% |
| West County | 94.6% | 94.4% | -0.2% | $1,403 | $1,467 | 4.6% |
| Central West End | 90.1% | 89.8% | -0.3% | $1,407 | $1,470 | 4.5% |
| Mid County | 93.9% | 93.8% | -0.2% | $1,257 | $1,312 | 4.4% |
| St Charles County | 94.6% | 94.4% | -0.1% | $1,350 | $1,409 | 4.4% |
| South St Louis City | 90.4% | 89.9% | -0.4% | $1,117 | $1,163 | 4.1% |
| North St Louis City | 82.3% | 81.5% | -0.8% | $688 | $715 | 4.0% |
| North County | 82.1% | 81.4% | -0.8% | $862 | $896 | 3.9% |
| Downtown Saint Louis | 83.5% | 83.0% | -0.5% | $1,184 | $1,229 | 3.8% |
| Market | 91.1% | 90.8% | -0.2% | $1,170 | $1,222 | 4.4% |
3Q 2023 Unit Inventory
Number of Units Under Construction
Number of Units UC Delivering
In the Next 4 Quarters
| Submarket | Unit Inventory: 3Q 2023 | Units Under Construction | % of Existing Inventory UC | % of Total UC | Units UC Delivering In the Next 4 Quarters |
|---|---|---|---|---|---|
| Bond County | 62 | 0 | 0.0% | 0.0% | 0 |
| Central West End | 12,036 | 0 | 0.0% | 0.0% | 0 |
| Clinton County | 118 | 0 | 0.0% | 0.0% | 0 |
| Crawford County | 101 | 0 | 0.0% | 0.0% | 0 |
| Downtown Saint Louis | 11,673 | 674 | 5.8% | 23.5% | 609 |
| Franklin County | 909 | 0 | 0.0% | 0.0% | 0 |
| Jefferson County | 3,325 | 96 | 2.9% | 3.4% | 96 |
| Jersey County | 47 | 0 | 0.0% | 0.0% | 0 |
| Lincoln County | 453 | 0 | 0.0% | 0.0% | 0 |
| Macoupin County | 113 | 0 | 0.0% | 0.0% | 0 |
| Metro East | 13,931 | 0 | 0.0% | 0.0% | 0 |
| Mid County | 27,892 | 920 | 3.3% | 32.1% | 674 |
| North County | 17,246 | 0 | 0.0% | 0.0% | 0 |
| North St Louis City | 1,480 | 60 | 4.1% | 2.1% | 60 |
| Outlying Madison County | 2,444 | 0 | 0.0% | 0.0% | 0 |
| South County | 12,154 | 0 | 0.0% | 0.0% | 0 |
| South St Louis City | 13,018 | 330 | 2.5% | 11.5% | 23 |
| St Charles County | 19,293 | 489 | 2.5% | 17.1% | 310 |
| Warren County | 731 | 0 | 0.0% | 0.0% | 0 |
| West County | 9,392 | 296 | 3.2% | 10.3% | 67 |
| Market | 146,418 | 2,865 | 2.0% | 100.0% | 1,839 |
Preliminary MSCI data shows that 2023 ended on a subdued note for sales of conventional multifamily assets compared to the previous year, yet performed reasonably well against historical standards. The fourth quarter of 2023 recorded a sales volume of $177.5 million, which, though significantly lower than 2022 and 2021, surpassed the same quarter’s volume for most years between 2014 and 2024. The entire year saw transactions totaling $628.9 million from 34 individual asset sales, aligning with pre-pandemic averages. The decline in price per unit (PPU) indicates that most traded assets were of a lower caliber. Looking forward to 2024, if interest rates stabilize or decrease, the region could offer long-term opportunities for astute investors, especially in the context of more attractively priced deals, reinforcing its status as a top multifamily investment destination in the Midwest.
* Trailing 4Q average PPU
* Preliminary Data from RCA – Individual transaction $2.5M +
P = Preliminary
| Sector | Employment Change 2023 to 2024 | Percent Change |
|---|---|---|
| Overall Employment | 5,600 | 0.4% |
| Manufacturing | (300) | -0.3% |
| Construction | (1,300) | -1.9% |
| Trade, Transport., & Utilities | (700) | -0.3% |
| Information | 100 | 0.4% |
| Financial Activities | (100) | 0.0% |
| Professional & Business Services | 2,900 | 1.3% |
| Education & Health Services | 3,000 | 1.1% |
| Government | (600) | -0.4% |
| Lesuire & Hospitality | 2,500 | 1.6% |
| Other Services | 100 | 0.2% |
The St. Louis metro economy is expected to experience a moderate pace of growth in 2024, supported by several key developments. One significant boost is Boeing’s plan to invest $1.8 billion near Lambert International Airport, which is set to enhance manufacturing job opportunities in the area. Additionally, the expansion of the John Cochran V.A. Medical Center is poised to contribute to the growth of healthcare jobs in the region. Another noteworthy project is the $1.2 billion Gateway South project, which if it breaks ground, is anticipated to bolster St. Louis’ already strong reputation for innovation. However, the landscape is not without its challenges. Elevated interest rates could potentially dampen hiring in construction and financial services. Despite this, St. Louis’ low living and business costs, coupled with its well-educated workforce, are expected to attract startups and support the professional business services sector. The outlook for 2024 is one of continued job growth, primarily driven by the healthcare sector, with cautious optimism for future expansion fueled by strategic investments and a competitive business environment.