Phoenix 2Q23
Multifamily Market Report

$1,612

average rent

93.2%

average occupancy rate

$1.2B

ytd sales volume

-4.0%

YoY rent change

-2.6 POINTS

yoy occupancy change

27

ytd individual transactions

Supply & Demand

2Q23

3,401 Units

QUARTERLY DEMAND
YTD: 6,585

4,716 Units

QUARTERLY COMPLETIONS
YTD: 9,070

Annual Demand vs Completions

2018
11,226
8,539
2019
10,089
8,625
2020
9,053
8,544
2021
14,923
10,981
2022
-1,462
14,274
2023 YTD
6,585
9,070
  • Planned
    Completions
  • Pre-Planned
    Demand

Demand Trends

  • In the Phoenix-Mesa-Scottsdale apartment market, a resurgence in demand began in early 2023 and continued into the second quarter, with a total of 3,401 units absorbed from April to June.

  • In 2Q 2023, demand reached a total of 3,401 units, signifying the highest level of quarterly absorption since the third quarter of 2021. This resurgence elevated annual demand to approximately 5,200 units for the year ending in the second quarter of 2023, achieving the first positive annual absorption reading in a year.

Completion Trends

  • Though demand improved, it simultaneously fell short of the new supply. In the second quarter of 2023, Phoenix witnessed the delivery of more than 4,700 apartment units. Over the last four quarters apartment inventory has expanded by a staggering 4.2%.

  • Over the past four quarters, the submarkets of Avondale / Goodyear / West Glendale (12.8%), Central Phoenix (12.0%), and Gilbert (11.6%) experienced the highest net inventory growth.

Demand Outlook

  • As the first half of 2023 has shown, the Phoenix market continues to be a powerhouse in apartment demand. This strength is attributed to its relative affordability, strategic proximity to high-cost markets in Southern California, and a flourishing economy.

  • Demand is projected to remain robust over the next four quarters; however, fundamentals will face challenges due to the anticipated wave of 30,000 units expected to come online during this period.

New Supply Outlook

  • Despite an uptick in absorption during the first half of 2023, the Phoenix apartment market continues to grapple with significant supply challenges.

  • As of the end of the second quarter in 2023, approximately 52,500 units were under construction, marking the second-highest level nationally, trailing only behind Dallas.

Occupancy & Rent Trends

RENT VS OWN
MONTHLY PAYMENT

$3,642

Average Monthly Mortgage Payment

$1,612

Average Monthly Rent

Occupancy trends

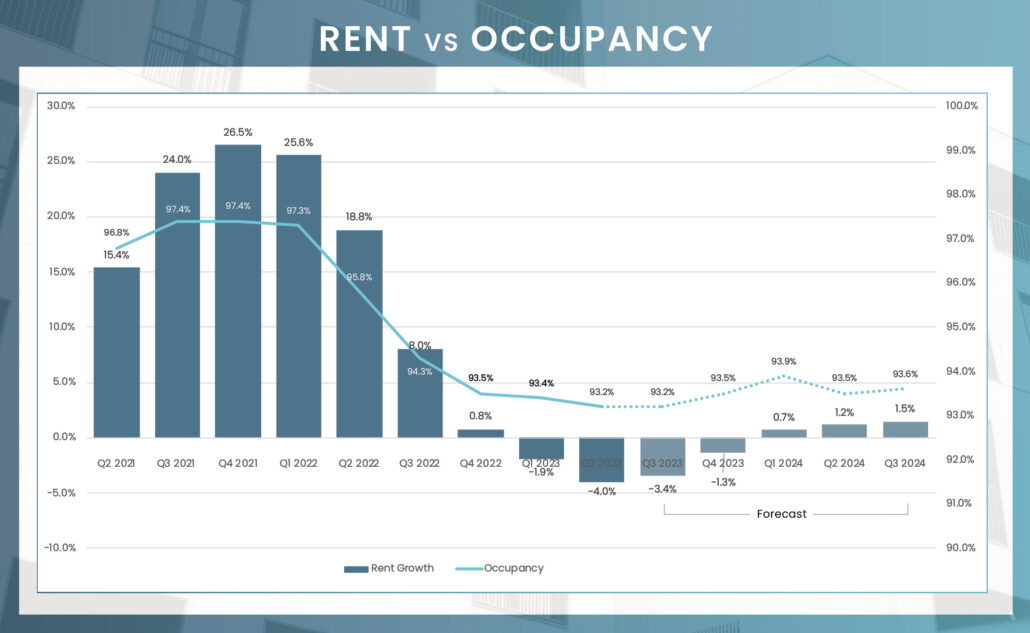
An imbalance between supply and demand led to a decrease in Phoenix’s occupancy rate, dipping 2.6 points from the previous year to stand at 93.2% in the second quarter of 2023. This is nearly 300 basis points below the market’s pre-pandemic rate in the first quarter of 2020, marking the weakest occupancy rate in recent memory. Examining the performance of the different product classes in Phoenix reveals a pattern where occupancy either dipped or remained stable across various price ranges. Leading the market were Class B and C assets, with occupancy rates of 93.2% and 93.3%, respectively. In contrast, Class A products experienced a noticeable decline during the quarter, falling by 0.9 points to 92.9%, falling below 93% for the first time in ten years. Submarket-level occupancy also showed muted performance, with all 23 submarkets falling well below the 95% mark. South Phoenix led the market at 94.2%, while Pinal County lagged behind at 91.3%.

RENTAL TRENDS

With occupancy rates weakening, pricing power in Phoenix continued to diminish. Operators reduced rents by 0.5% quarter-over-quarter, resulting in a 4.0% decrease on an annual basis. This annual performance marked the market’s weakest rent adjustment in 13 years. In a detailed view, rents fell in 22 out of Phoenix’s 23 submarkets over the past year, with the low-supply West Phoenix area being the sole exception, achieving a 2.8% annual rent growth. Among the different product classes, Class C products, known to be more sensitive to affordability constraints, saw the steepest year-over-year rent reduction of 5.6%. Conversely, Class A and B operators trimmed rents by 2.2% and 4.2%, respectively, in the year-ending second quarter.

Submarket Rent & Occupancy

SubmarketAverage OccupancyAnnual Occupancy ChangeAverage Monthly RentAnnual Rent Change
Central Phoenix93.1%-2.0%$1,793-3.5%
North Central Phoenix92.5%-2.9%$1,616-3.6%
East Phoenix93.0%-3.1%$1,497-1.9%
South Phoenix94.2%-1.6%$1,648-5.8%
West Phoenix91.5%-4.9%$1,1752.8%
Far West Phoenix92.9%-2.9%$1,381-4.2%
Northwest Phoenix93.3%-2.4%$1,303-1.0%
Northeast Phoenix93.7%-2.2%$1,517-4.4%
Deer Valley93.1%-2.3%$1,757-3.1%
North Scottsdale93.4%-2.1%$2,031-2.5%
South Scottsdale93.5%-2.3%$1,950-3.1%
North Tempe/University92.9%-2.6%$1,748-2.5%
South Tempe93.6%-2.2%$1,640-3.0%
Northwest Mesa93.6%-2.0%$1,420-4.2%
Southwest Mesa92.7%-3.3%$1,421-5.9%
East Mesa93.6%-2.4%$1,678-5.5%
Gilbert92.8%-2.7%$1,741-7.1%
Chandler93.7%-2.4%$1,735-5.8%
Pinal County91.3%-6.4%$1,371-4.0%
Avondale/Goodyear/West Glendale92.7%-3.0%$1,636-6.4%
South Glendale92.6%-3.4%$1,281-3.0%
North Glendale93.3%-1.6%$1,601-5.7%
Peoria/Sun City/Surprise94.0%-2.2%$1,648-4.2%

Units by Submarket Delivering in 2023

52,475

Units Under Construction

30,257

Units UC Delivering In the Next 4 Quarters

Percentage of Units Under Construction

Central Phoenix - 4,900
0%
North Central Phoenix - 1,207
0%
East Phoenix - 648
0%
South Phoenix - 2,192
0%
West Phoenix - 0
0%
Far West Phoenix - 509
0%
Northwest Phoenix - 342
0%
Northeast Phoenix - 1,082
0%
Deer Valley - 2,341
0%
South Overland Park - 684
0%
North Scottsdale - 2,423
0%
South Scottsdale - 905
0%
North Tempe/University - 4,135
0%
South Tempe - 113
0%
Northwest Mesa - 1,030
0%
Southwest Mesa - 203
0%
East Mesa - 2,997
0%
Gilbert - 3,400
0%
Chandler - 1,837
0%
Pinal County - 4,179
0%
Avondale/Goodyear/West Glendale - 13,394
0%
South Glendale - 358
0%
North Glendale - 182
0%
Peoria/Sun City/Surprise - 4,098
0%

Percentage of Units Delivering Next 4Q

Central Phoenix - 1,524
0%
North Central Phoenix - 857
0%
East Phoenix - 438
0%
South Phoenix - 1,191
0%
West Phoenix - 0
0%
Far West Phoenix - 228
0%
Northwest Phoenix - 190
0%
Northeast Phoenix - 1,082
0%
Deer Valley - 1,649
0%
South Overland Park - 47
0%
North Scottsdale - 1,311
0%
South Scottsdale - 905
0%
North Tempe/University - 2,185
0%
South Tempe - 113
0%
Northwest Mesa - 560
0%
Southwest Mesa - 203
0%
East Mesa - 1,838
0%
Gilbert - 1,934
0%
Chandler - 1,316
0%
Pinal County - 2,374
0%
Avondale/Goodyear/West Glendale - 7,547
0%
South Glendale - 52
0%
North Glendale - 182
0%
Peoria/Sun City/Surprise - 2,999
0%

Sales Activity

During the first half of 2023, the Phoenix market experienced a considerable decline in transaction volume for conventional multifamily properties. Transaction amounts fell to approximately $1.2 billion, a significant drop from the previous year’s first half volume of $5.3 billion, representing a year-over-year decrease of about 77%. Concurrently, the number of individual transactions also plummeted, going from 135 to just 27. This downturn can primarily be attributed to two key factors: the astronomical increase in finance pricing and the bloated construction pipeline, both of which have been exerting considerable pressure on the fundamentals in Phoenix.

  1. Rise48 Equity
  2. Ctvrtlik & Ctvrtlik
  3. Decron Properties Corp
  4. Tides Equities
  5. Knightvest Capital
  1. Sheiner Group
  2. Capital RE (CO)
  3. Tides Equities
  4. PB Bell & Associates
  5. JLB Partners

TRANSACTION VOLUME


YTD Transaction Volume


Y-O-Y Change


Individual Transaction Count


Price Per Unit


Annual Price Change

* Trailing 4Q average PPU

* Preliminary Data from RCA – Individual conventional MF transaction $2.5M +

Economy

In May 2023, the Phoenix metro area’s job landscape presented a relatively positive picture. Total nonfarm employment saw an increase of 1.6%, adding 37,500 jobs compared to the same month in 2022, bringing total payrolls to 2.53 million in Phoenix. The education and health services sector sector experienced the most substantial job gains with an addition of 19,700 positions, representing a solid 5.5% expansion. The construction sector saw a healthy increase of 3.2%, which equated to an additional 4,800 jobs. Meanwhile, the leisure and hospitality sector sector, vital for Phoenix’s economy, observed a 3.1% increase, equivalent to an addition of 7,300 jobs. Overall, Phoenix’s unemployment rate dropped 10 basis points year over year to 3.6%.

37.5K

May Annual Jobs Created

1.6%

May 23 Employment growth

2.8%

May 23 Unemployment rate
3.4% us may rate

Top 5 Employment Sector Annual Change

Education & Health Services

Professional & Business Services

Change from May 2022 to May 2023:
19,700

Percent Change:
5.5%

Government

Manufacturing

Change from May 2022 to May 2023:
8,400

Percent Change:
3.5%

Leisure & Hospitality

Professional & Business Services

Change from May 2022 to May 2023:
7,300

Percent Change:
3.1%

Construction

Professional & Business Services

Change from May 2022 to May 2023:
4,800

Percent Change:
3.2%

Professional & Business Services

Professional & Business Services

Change from May 2022 to May 2023:
3,500

Percent Change:
0.9%

Hover over icons to view data
Tap icons to view data
SectorChange from May 2022 to May 2023 Percent Change
Education and health services19,7005.50%
Government8,4003.50%
Leisure and hospitality7,3003.10%
Construction4,8003.20%
Professional and business services3,5000.90%
Manufacturing3,3002.30%
Mining and logging30010.00%
Financial activities-1,000-0.50%
Information-1,900-4.30%
Trade, transportation, and utilities-3,300-0.70%
Other services-3,600-4.90%

Major Economic Developments

TSMC Microchip Fabrication Facility

$40B Capital Investment

20K Jobs Created

Fabricate High-End Microchips What

North Phoenix Location

2024 Expected Completion

LG Energy Solution Gigafactory

$1.4B Capital Investment

2.5K Jobs Created

EV Battery Factory What

Queen Creek Location

2024/25 Expected Completion

Nestlé Bottling Facility

$675M Capital Investment

500 Jobs Created

State of The
Art Beverage Bottling Facility
What

Glendale Location

2024 Expected Completion

Market Outlook

Despite a robust absorption in the first half of 2023, the Phoenix apartment market grapples with significant supply challenges. With roughly 52,500 units under construction at the end of Q2 2023, and a record 30,300 units slated for delivery over the next four quarters, the market is witnessing unparalleled expansion. However, Phoenix’s profile aligns with many recent outperforming markets, characterized by affordability, massive in-migration, business diversification, and a thriving single-family market. Although the surge in supply poses a temporary concern, the long-term prospects remain positive. The unique blend of factors that propelled Phoenix’s growth is likely to align its performance closer to national norms by early 2025, once the current wave of supply moderates. This transition symbolizes a maturing market that continues to offer opportunities but in a more stabilized environment.

Sources: RealPage; BLS; MSCI; Phoenix Business Journal; Phoenix Chamber Of Commerce.

To Gain Further Insights Into The Phoenix Market Please Reach Out To Our local Team

Image of Alex

Alex Blagojevich

Executive Managing Director / Co-Founder

Image of Michael Sullivan

Michael Sullivan

Executive Managing Director / Co-Founder

Image of Brett

Brett Meinzer

Managing Director