
$1,724 4Q 2023
$1,756 4Q 2024
1.4%
93.1% 4Q 2023
92.8% 4Q 2024
-30 points
1.44M 2023
1.46M 2024
2.8% 2023
3.8% 2024
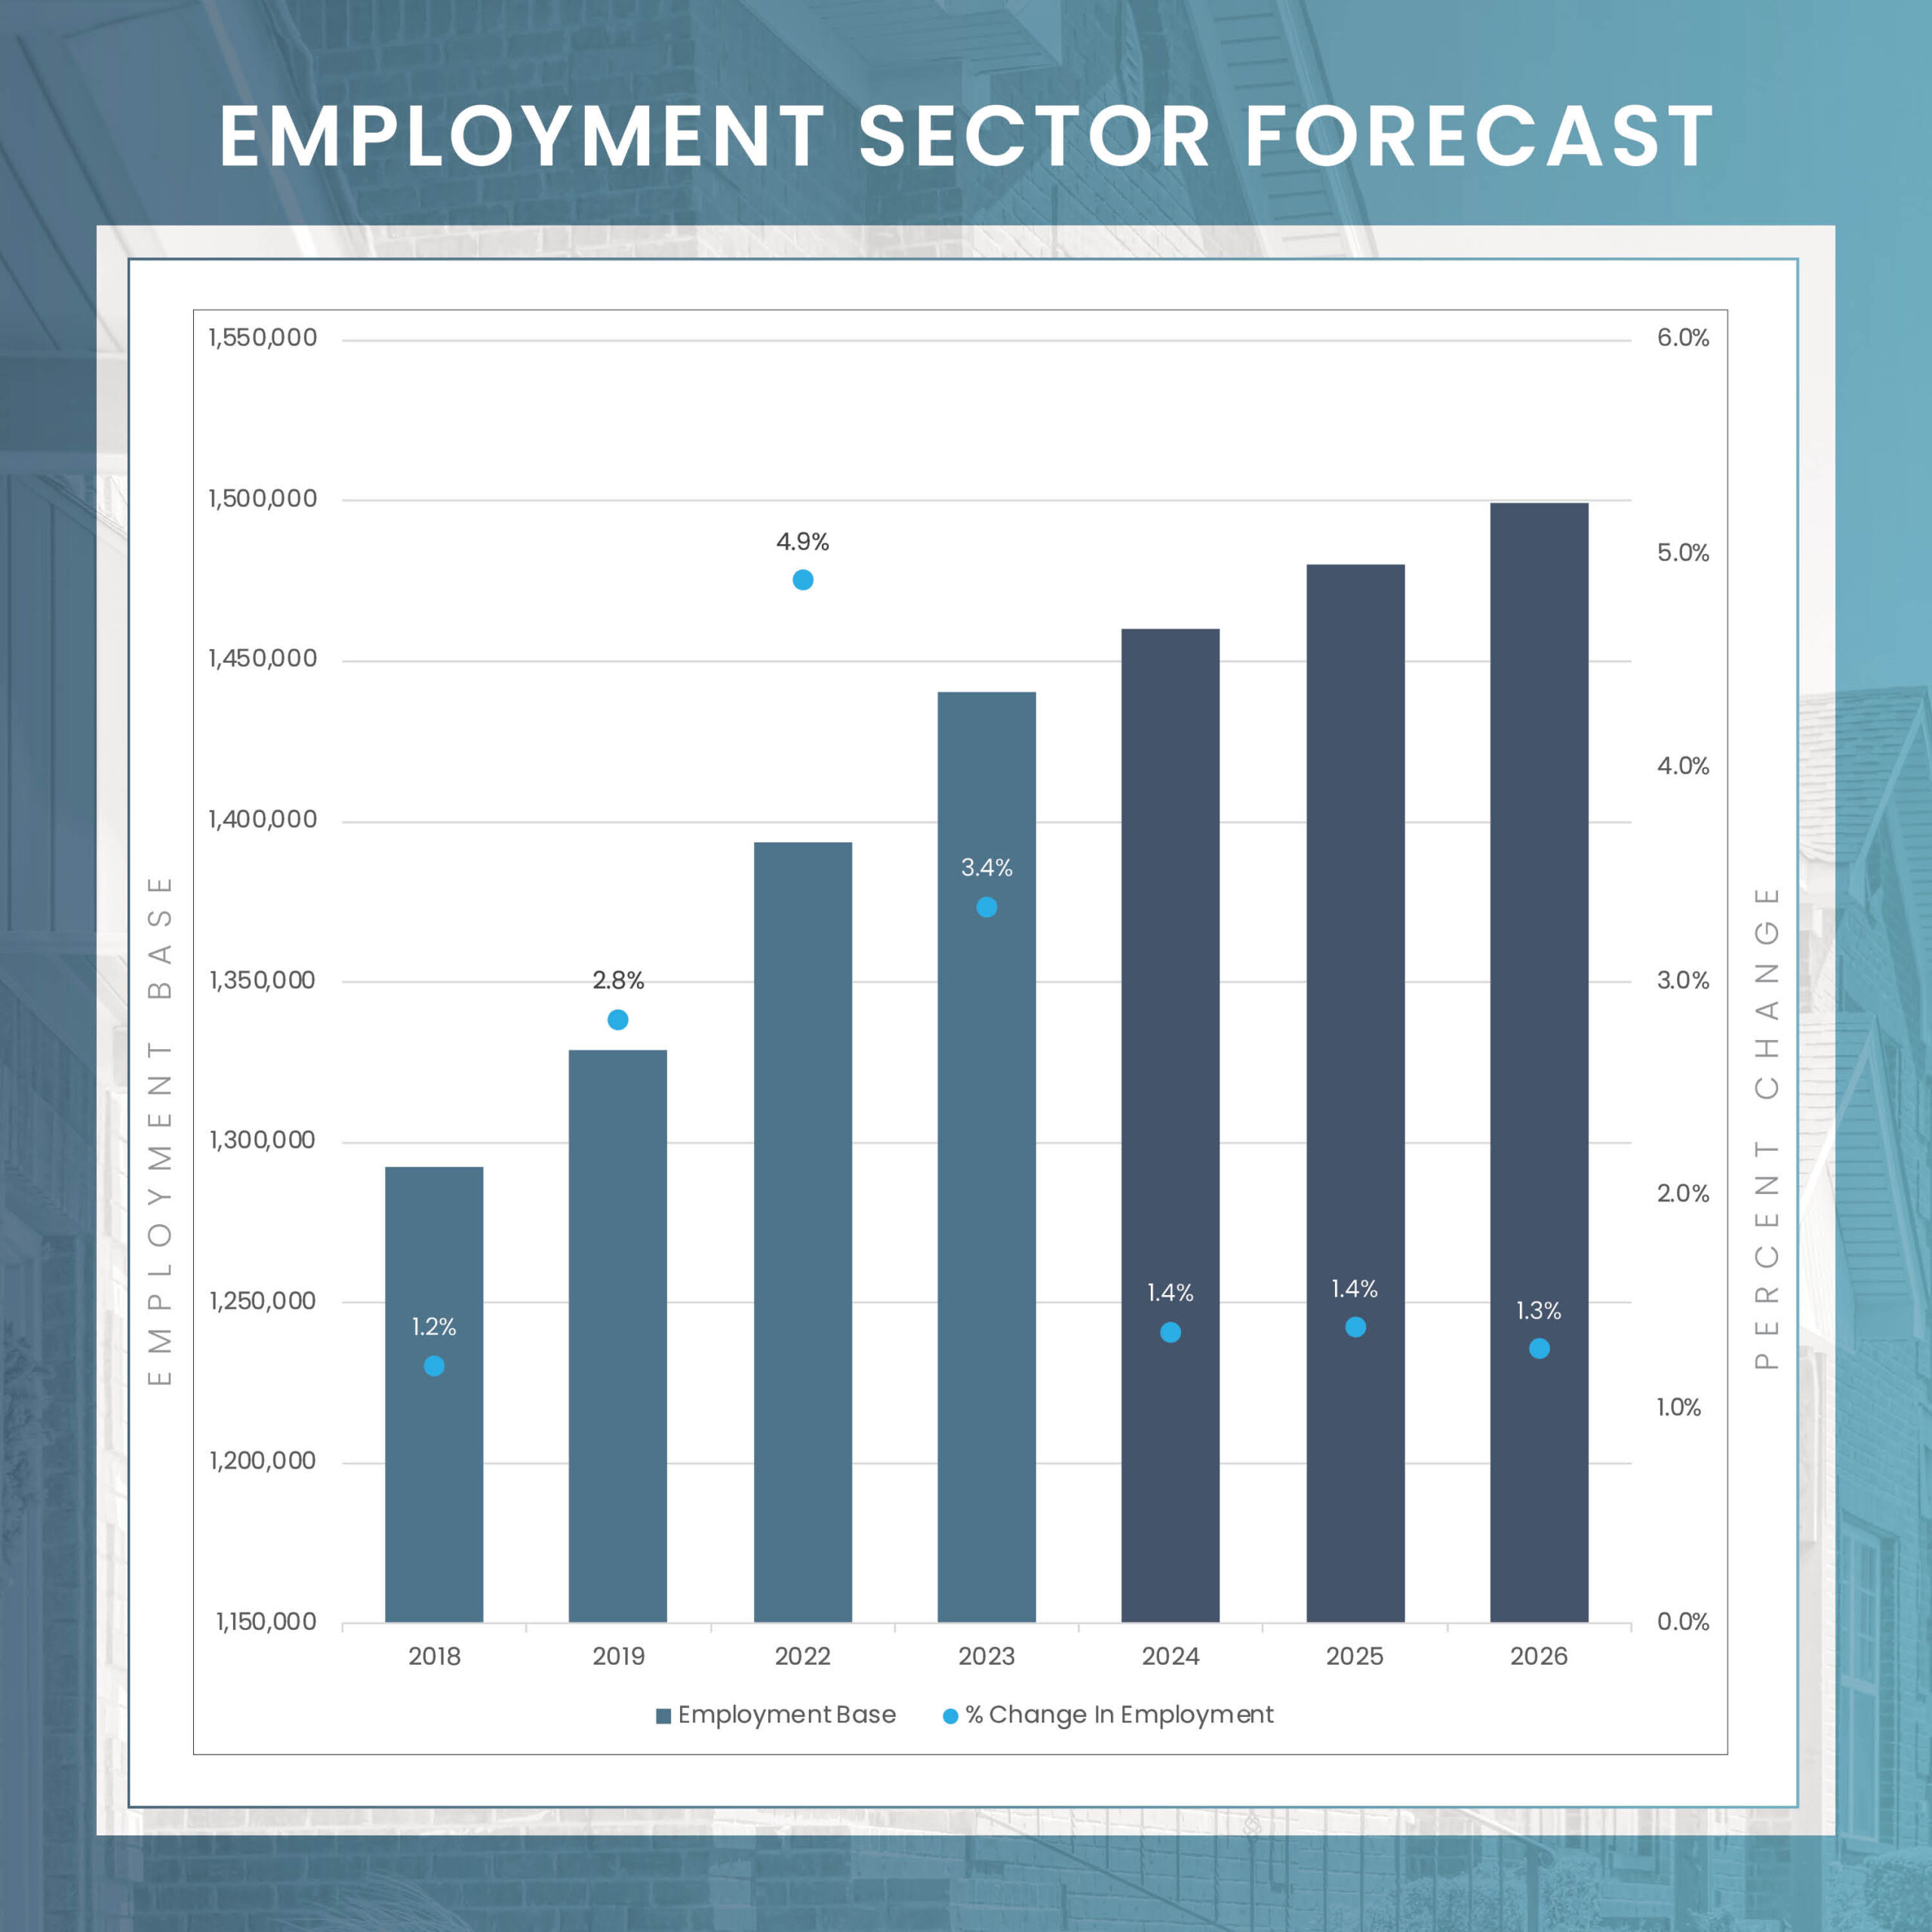
* Please note that these employment figures have been adjusted for seasonal variations and are based on Moody’s Analytics forecast as of January 1, 2024.
** Please note that these unemployment rates are estimates that have not been adjusted for seasonal variations, and they are derived from Moody’s Analytics forecast as of January 1, 2024.
FORECASTED ABSORPTION
FORECASTED NEW SUPPLY
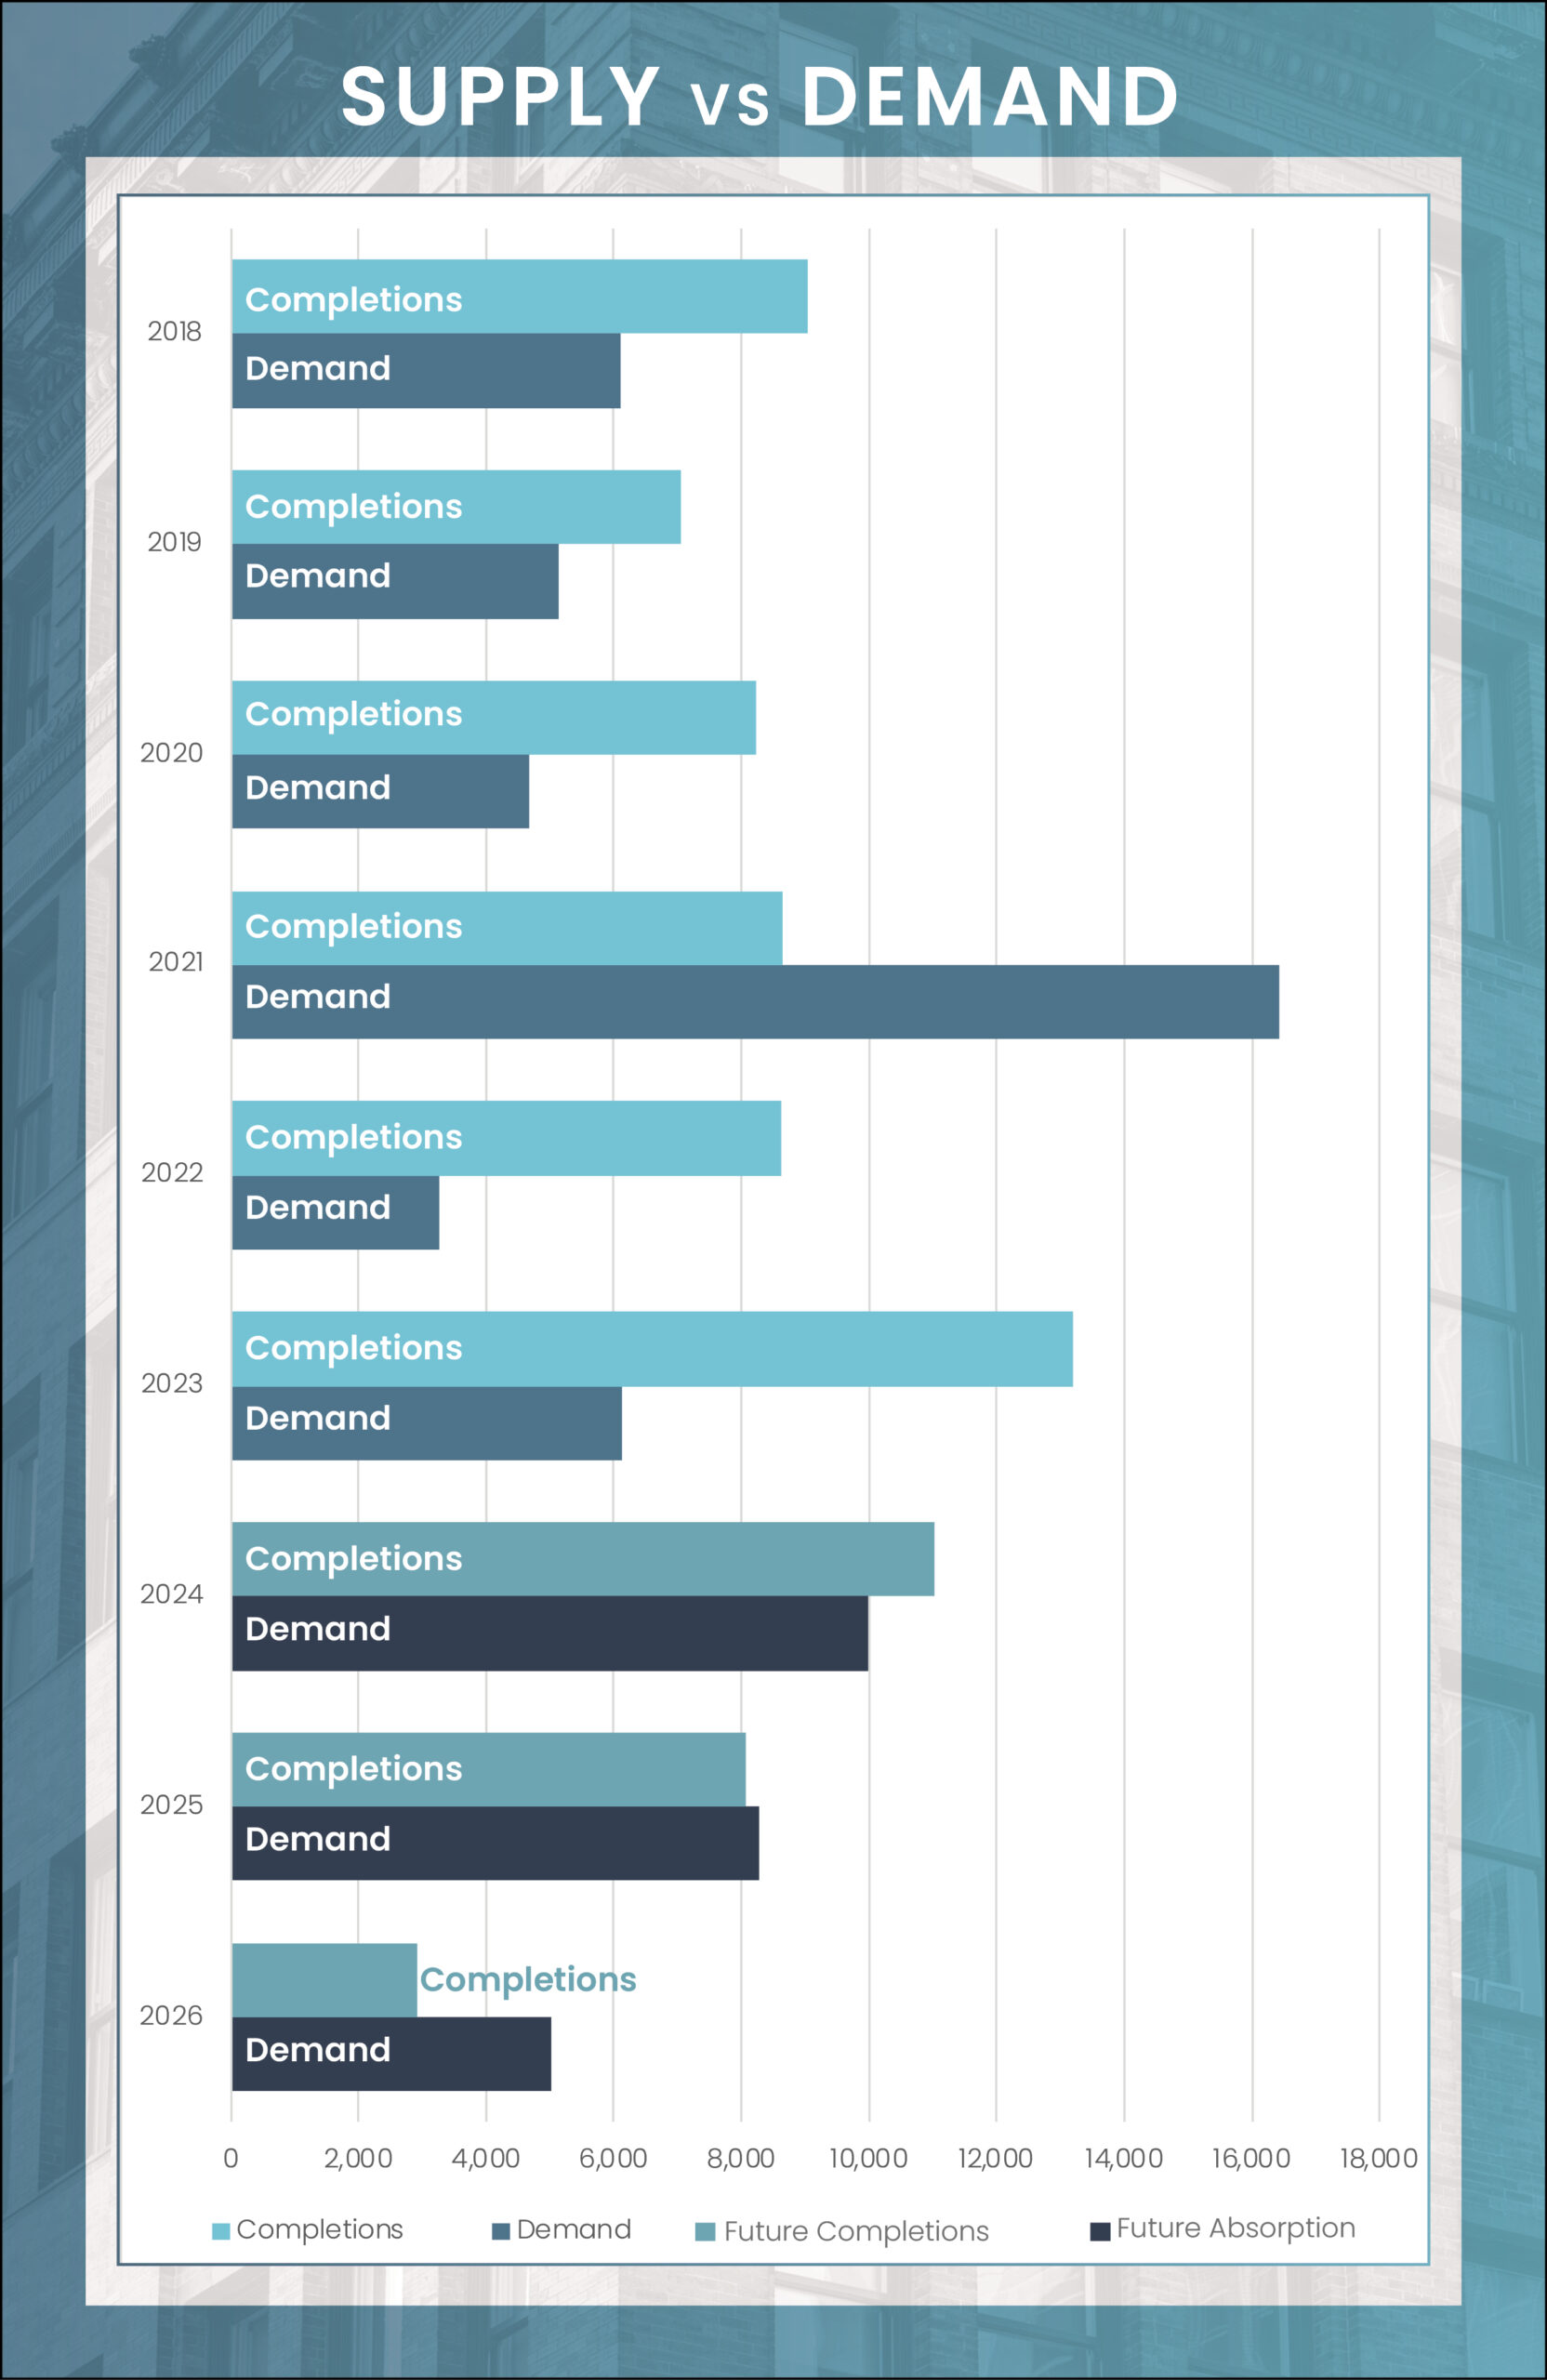
In 2024, Orlando’s multifamily market is set to showcase stronger fundamentals, with a more balanced dynamic between supply and demand. The forecast indicates an upswing in absorption, with projections showing an increase from 6,200 units in 2023 to nearly 10,000 units in 2024. However, this growth in demand is juxtaposed with a slight reduction in the introduction of new apartments – a decrease of two thousand units from the previous year. Despite this decrease, the volume of new apartment deliveries remains historically high. Consequently, for the third consecutive year, the pace of new supply is expected to exceed net absorption, though the margin of this surplus is predicted to be narrower than in 2022 and 2023.
The occupancy rate, currently standing at 93.1%, is anticipated to experience a slight dip to 92.8% by the end of the year. Demand should continue to be healthy in Orlando’s western corridor. While a decrease in occupancy rates is likely across all submarkets, Osceola County is expected to maintain a strong occupancy level, above 96%. This enduring demand is partially attributed to in-migration from more expensive metropolitan areas like Miami, which fuels the sustained interest in high-tier housing units in Central Florida.
The multifamily sector in Orlando has undergone significant expansion, largely propelled by substantial population growth in the past four years. This growth has positioned Orlando as one of the leading cities in the nation in terms of construction pipeline relative to its total housing inventory. Illustrating this growth, the city witnessed the completion of over 13,100 new multifamily units last year, the largest one-year expansion in Orlando’s history. As of the first quarter of 2024, there were over 20,000 apartment units in various stages of development representing 9.5% of the existing supply.
Projections suggest the addition of just over 11,000 units in the next four quarters. While this figure marks a decrease of approximately 2,000 units from the level delivered in 2023, it remains considerably higher than the historical average. Notably, construction development is concentrated in the I Drive Orlando and Southwest Orlando submarkets, which together account for nearly 40% of the total market-wide pipeline. Over the next 12 months, six of Orlando’s 13 submarkets will see unit additions totaling over 1,000 units. For detailed delivery levels in each submarket, refer to our construction pipeline breakout below.
Average Monthly Mortgage Payment
Average Monthly Rent
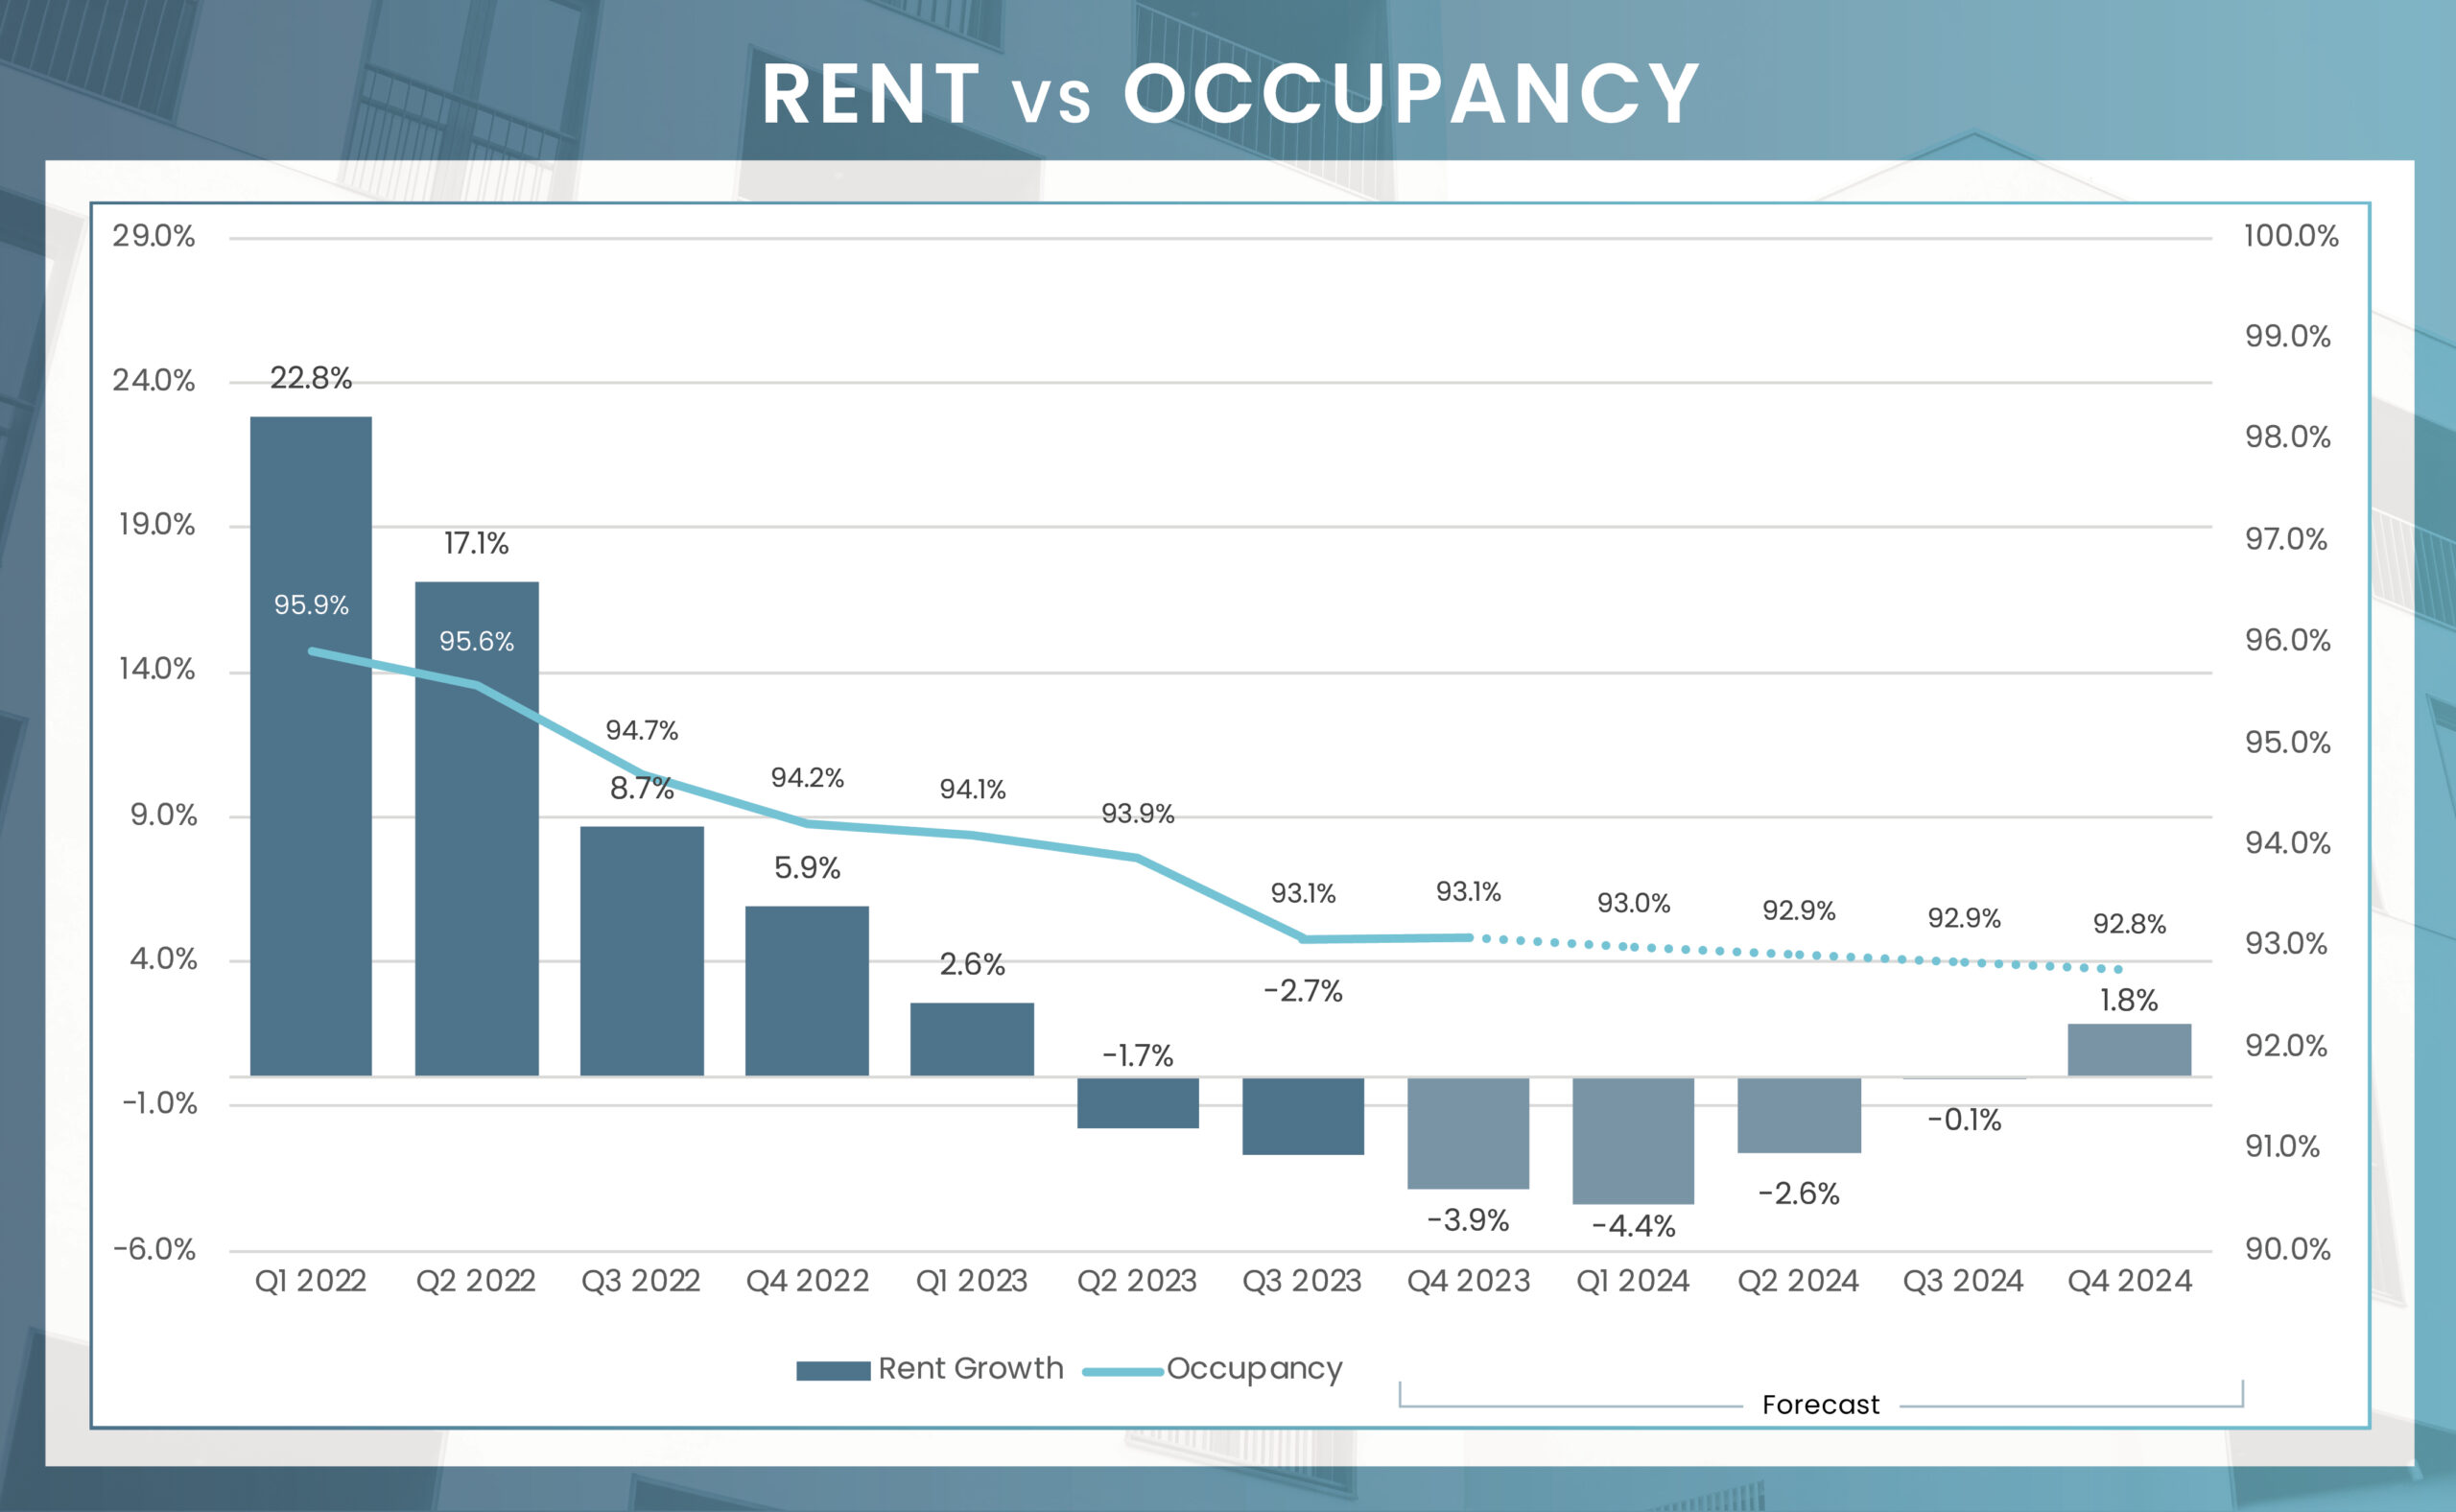
The Orlando multifamily market has recently witnessed a notable deceleration in year-over-year rent growth. This slowdown culminated in a decrease in rents of 3.9% in the final quarter of 2023, placing it significantly below the national average of 0.8%. This period of negative growth is likely to extend until the latter part of 2024. It is around this time that we can anticipate a shift towards positive growth, potentially reaching 1.4% on an annual basis by the fourth quarter of 2024.
2024 is poised to be a transitional year of adjustment for the multifamily market in the Orlando metro area. Despite the challenges and shifts in the market dynamics, the underlying demand fundamentals in Orlando remain robust and intact. A key driver of this resilience is the metro’s continued population growth, which is expected to be among the highest in the United States. According to data from the U.S. Census Bureau, Orlando is experiencing a significant influx of new residents, with approximately 1,200 people moving to the city each week. This steady population increase is a critical factor underpinning the strong demand for multifamily housing in the region. It suggests that, despite short-term market adjustments, the long-term outlook for Orlando’s multifamily market remains positive, buoyed by the metro’s ongoing population growth and the consequent sustained demand for housing.
| Submarket | Q4 2023 Stabilized Occupancy | Q4 2024 Stabilized Occupancy (f) | Annual Occupancy Change (2024/2023) | Q4 2023 Average Monthly Rent | Q4 2024 Average Monthly Rent (f) | Annual Rent Change (2024/2023) |
|---|---|---|---|---|---|---|
| Downtown Orlando | 93.7% | 93.4% | -0.3% | $1,850 | $1,890 | 2.1% |
| East Orlando | 92.3% | 92.0% | -0.4% | $1,639 | $1,674 | 2.1% |
| East Outlying | 94.8% | 94.6% | -0.2% | $1,910 | $1,940 | 1.6% |
| Eastside | 93.5% | 93.2% | -0.3% | $1,688 | $1,722 | 2.1% |
| I Drive Orlando | 92.8% | 92.5% | -0.3% | $1,853 | $1,889 | 1.9% |
| Lake Nona | 93.3% | 93.1% | -0.2% | $1,993 | $2,027 | 1.7% |
| North Orlando | 92.8% | 92.5% | -0.4% | $1,663 | $1,692 | 1.7% |
| Northwest Orlando | 94.2% | 93.9% | -0.3% | $1,674 | $1,699 | 1.5% |
| Osceola County | 96.6% | 96.3% | -0.2% | $2,060 | $2,087 | 1.3% |
| South Orlando | 94.3% | 94.0% | -0.3% | $1,610 | $1,643 | 2.1% |
| Southwest Orlando | 92.7% | 92.3% | -0.4% | $1,783 | $1,808 | 1.4% |
| West Orlando | 91.6% | 91.2% | -0.4% | $1,534 | $1,563 | 1.9% |
| Windermere | 93.2% | 93.0% | -0.3% | $1,978 | $2,004 | 1.4% |
| Market | 93.1% | 92.8% | -0.3% | $1,724 | $1,756 | 1.4% |
4Q 2023 Unit Inventory
Number of Units Under Construction
Number of Units UC Delivering
In the Next 4 Quarters
| Submarket | Unit Inventory: 4Q 2023 | Units Under Construction | % of Existing Inventory UC | % of Total UC | Units UC Delivering In the Next 4 Quarters |
|---|---|---|---|---|---|
| I Drive Orlando | 32,770 | 4,019 | 12% | 19.9% | 1,273 |
| Southwest Orlando | 17,709 | 3,997 | 23% | 19.8% | 1,628 |
| North Orlando | 37,846 | 2,220 | 6% | 11.0% | 1,492 |
| Osceola County | 1,393 | 2,106 | 151% | 10.4% | 1,624 |
| Northwest Orlando | 12,521 | 1,970 | 16% | 9.7% | 1,065 |
| Lake Nona | 8,178 | 1,865 | 23% | 9.2% | 1,236 |
| South Orlando | 28,815 | 1,657 | 6% | 8.2% | 692 |
| Downtown Orlando | 12,980 | 812 | 6% | 4.0% | 459 |
| West Orlando | 17,428 | 472 | 3% | 2.3% | 469 |
| East Orlando | 21,309 | 400 | 2% | 2.0% | 395 |
| Windermere | 4,912 | 373 | 8% | 1.8% | 372 |
| East Outlying | 3,253 | 300 | 9% | 1.5% | 299 |
| Eastside | 12,687 | 27 | 0% | 0.1% | 24 |
| Market | 211,801 | 20,218 | 9.5% | 100.0% | 11,028 |
Preliminary data from MSCI indicates that the sales volume for conventional multifamily assets concluded 2023 on an acceptable note. The final quarter of 2023 saw sales volume of $365.8 million, well below the fourth quarter totals in 2021 and 2022, but on par with 2019. In turn, annual transaction volume reached $1.6 billion across 27 individual asset sales, representing a 69% decrease in dollar volume from the previous year. Looking ahead to 2024, should interest rates stabilize or fall, the persistent tailwinds fueling Orlando’s exponential rise as a top multifamily investment destination could present savvy investors with long-term opportunities, particularly as more attractively priced deals emerge.
*Most Active Buyers and Sellers are based on the sale volume of apartment units.
* Trailing 4Q average PPU
* Preliminary Data from RCA – Individual transaction $2.5M +
P=Preliminary
| Sector | Employment Change 2023 to 2024 | Percent Change |
|---|---|---|
| Overall Employment | 19,600 | 1.4% |
| Manufacturing | 1,000 | 1.9% |
| Construction | 600 | 0.7% |
| Trade, Transport., & Utilities | 4,000 | 1.4% |
| Information | 300 | 1.1% |
| Financial Activities | 1,100 | 1.1% |
| Professional & Business Services | 1,100 | 0.4% |
| Education & Health Services | 6,900 | 3.8% |
| Government | 900 | 0.6% |
| Lesuire & Hospitality | 3,800 | 1.4% |
| Other Services | (100) | -0.2% |
The Orlando Metropolitan region is set for a significant upswing in both population and employment in 2024, laying a strong foundation for sustained demand in the housing market and supporting long-term appreciation in home values. Our forecast projects the creation of 19,600 new jobs, an expansion of 1.4%, with the Education and Health Services sector leading this growth. This sector is anticipated to add 6,900 jobs, reflecting the region’s increasing focus on educational and health-related services. Additionally, the Trade, Transport, and Utilities sector, along with the Leisure and Hospitality industry, are expected to play substantial roles in employment growth in 2024, adding 4,000 and 3,800 jobs, respectively. Furthermore, the region’s attractiveness is being bolstered by an increasing number of industry leaders establishing their presence in Central Florida. This influx of businesses and industries is a key factor in stimulating both the local economy and the housing market, ensuring a future demand for multifamily housing in the Orlando metro area.


