Omaha 3Q23
Multifamily Market Report

$1,190

average rent

96.4%

average occupancy rate

$74.4M

ytd sales volume

5.8%

YoY rent change

-1.0 POINTS

yoy occupancy change

7

ytd individual transactions

Supply & Demand

3Q23

825 Units

QUARTERLY DEMAND
YTD: 1,535

916 Units

QUARTERLY COMPLETIONS
YTD: 2,546

Annual Demand vs Completions

2018
1,510
1,444
2019
2,417
1,958
2020
937
1,661
2021
2,317
1,135
2022
1,422
1,796
2023 YTD
1,535
2,546
  • Planned
    Completions
  • Pre-Planned
    Demand

Demand Trends

  • Although new apartment supply exceeded demand in Omaha for Q3 2023, the market absorbed 702 units—significantly higher than the third quarter five-year average of 564 units. This underscores the continued strength and resilience of Omaha’s multifamily sector.

  • Five of Omaha’s six submarkets experienced positive absorption this quarter. Notably, the sought-after West Omaha area accounted for nearly half of this quarter’s total absorption, with 342 units absorbed.

Completion Trends

  • In Q3 2023, Omaha’s apartment inventory expanded by 1,020 units, bringing the year-to-date total of new deliveries to 2,546 units.

  • West Omaha and Sarpy County were the primary drivers of this expansion, with these submarkets accounting for over three-quarters of the new units this period, totaling 762 units.

Demand Outlook

  • Recognized as a burgeoning tertiary market with a high quality of life, Omaha is projected to sustain demand that outpaces historical norms. An estimated 1,775 units are expected to be absorbed over the next four quarters.

  • In terms of geographic focus, Sarpy County and West Omaha are expected to be the primary submarkets drawing significant demand in the upcoming four quarters, with an estimated absorption of 1,100 units.

New Supply Outlook

  • Currently, Omaha has 3,140 units under construction, making up 3.5% of the existing apartment inventory. While this is slightly above the historical average, it’s a manageable proportion for local operators to efficiently fill. 

  • Of the units presently under construction, 2,504 are slated for completion in the next four quarters. The majority of these units are concentrated in the West Omaha, Sarpy County, and Central Omaha submarkets.

Occupancy & Rent Trends

RENT VS OWN
MONTHLY PAYMENT

$2,102

Average Monthly Mortgage Payment

$1,190

Average Monthly Rent

Occupancy trends

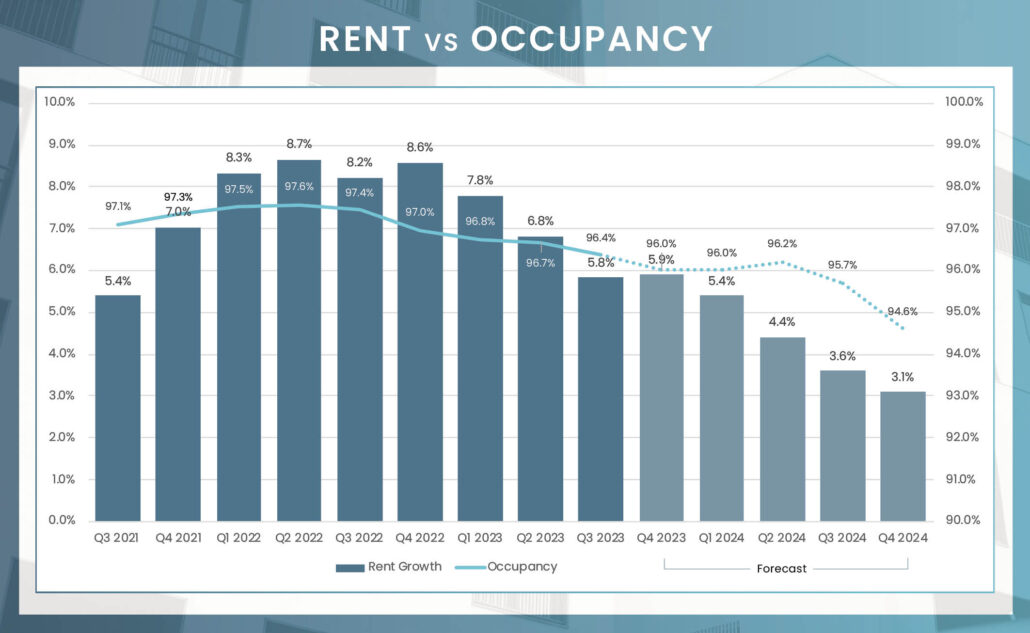
Despite a modest decline of 100 basis points over the 12 months leading up to September 2023, Omaha’s apartment market maintained a robust occupancy rate of 96.4%. This resilience stood out even in the face of a significant influx of new units in the third quarter. Notably, five of Omaha’s six submarkets sustained occupancy rates exceeding 95.5%, with West Omaha leading with a rate of 97.5%. The Council Bluffs submarket bucked the trend, posting a 280 basis point annual drop in occupancy. This decline is consistent with a general weakening in Class C properties in the area over the last two years, where average occupancy plummeted by 700 basis points. However, Class A and Class B assets in this submarket continued to demonstrate strong occupancy rates of 95.8% and 93.7%, respectively.

RENTAL TRENDS

In Q2 2023, the average monthly rental rate in Omaha increased to $1,190, reflecting a noteworthy 5.8% year-over-year growth. Despite a general moderation in rent increases, akin to trends in other U.S. multifamily markets, Omaha achieved the 8th highest rent growth among the nation’s 150 largest apartment markets, significantly outperforming the national average of 0.4%. Over the last three years, rents in Omaha have cumulatively risen by 26%. Shifting attention to Omaha’s submarkets, Sarpy County led the way with the highest annual rent increase, recording a substantial 7.3% expansion in rental rates. In contrast, North Omaha experienced a more moderate but still healthy annual increase of 4.3%. When breaking it down by property classes, Class A assets saw a 6.5% growth in rents, Class B assets followed with a 5.4% increase, and Class C properties slotted in between, registering a 5.7% uptick.

Submarket Rent & Occupancy

SubmarketAverage OccupancyAnnual Occupancy ChangeAverage Monthly RentAnnual Rent Change
Central Omaha96.4%-0.3%$1,1985.8%
North Omaha95.5%-1.6%$1,1474.3%
South Omaha96.4%-1.0%$1,1475.3%
West Omaha97.5%-0.9%$1,2355.8%
Sarpy County96.2%-1.0%$1,2197.3%
Council Bluffs93.1%-2.8%$1,1396.3%
Omaha96.4%-1.0%$1,1905.8%

Units by Submarket Delivering in 2023

3,140

Units Under Construction

2,504

Units UC Delivering In the Next 4 Quarters

Number of Units Under Construction

Central Omaha - 848
0%
Council Bluffs - 0
0%
North Omaha - 324
0%
Sarpy County - 814
0%
South Omaha - 132
0%
West Omaha - 1,022
0%

Number of Units Delivering Next 4Q

Central Omaha - 676
0%
Council Bluffs - 0
0%
North Omaha - 174
0%
Sarpy County - 630
0%
South Omaha - 132
0%
West Omaha - 892
0%

Sales Activity

Through Q3 2023, the total transaction volume for individual multifamily assets in Omaha reached $74.4 million, marking a 5.2% increase compared to the same period in 2022. Consistent with trends observed since 2021, private buyers were responsible for 100% of these transactions in the current year. The average market price per unit stood at approximately $119,000 in Q3 2023, presenting a considerable discount relative to the national average. Notably, Omaha’s multifamily market prices are over 50% lower than the average unit price across the United States.

TRANSACTION VOLUME


YTD Transaction Volume

Y-O-Y Change

YTD Individual Transaction Count

Price Per Unit

Annual Price Change

* Trailing 4Q average PPU

* Preliminary Data from RCA – Individual transaction $2.5M +

Economy

Preliminary data from the Bureau of Labor Statistics reveals that Omaha’s unemployment rate in May was 2.2%, which is notably below the U.S. average of 3.8%. Over the past year, employment in the metro area has seen positive shifts in several sectors. The leisure and hospitality sector took the lead by adding 3,000 jobs, a significant 5.6% increase. The education and health services sector followed closely, bringing in an additional 1,600 positions—a 2.0% rise. Overall, these gains have contributed positively to Omaha’s employment landscape.

5.4K

August Annual Jobs Created

1.1%

August 23 Employment growth

2.2%

August 23 Unemployment rate
3.8% us August rate

Top 5 Employment Sector Annual Change

Education & Health Services

Education & Health Services

Change from May 2022 to May 2023:
1,600

Percent Change:
2.0%

Leisure & Hospitality

Leisure & Hospitality

Change from May 2022 to May 2023:
3,000

Percent Change:
5.6%

Mining, Logging, & Construction

Mining, Logging, & Construction

Change from May 2022 to May 2023:
1,300

Percent Change:
3.9%

Government

Government

Change from May 2022 to May 2023:
1,300

Percent Change:
2.0%

Other Services

Other Services

Change from May 2022 to May 2023:
1,300

Percent Change:
7.0%

Hover over circles to view data
SectorChange from May 2022 to May 2023 Percent Change
Education and health services1,6002.00%
Leisure and hospitality3,0005.60%
Mining, logging, and construction1,3003.90%
Government1,3002.00%
Other services1,3007.00%
Trade, transportation, and utilities9001.00%
Manufacturing4001.10%
Information-100-1.00%
Financial activities-1,500-3.50%
Professional and business services-2,800-3.80%

Cost of Living Comparison

As of the most recent data, Omaha exhibits a Cost-of-Living Index of 92.8, making it a relatively affordable place to reside. The housing index stands at 83.7, reinforcing the affordability in the real estate sector. Utilities are moderately priced with an index of 95.0, while the cost for transportation, particularly gas, is fairly aligned with the national average at 100.2. n a comparative analysis between Kansas City MO-KS and Omaha NE, Omaha generally fares better in terms of affordability. Specifically, groceries in Omaha are 3.2% more expensive, but housing and utilities are 14.2% and 9.7% less expensive, respectively.

Kansas City, MO-KS vs. Omaha, NE
Cost of Living Comparison
Groceries:

3.2% More
Housing:

14.2% Less
Utilities:

9.7% Less
Transportation:

17.8% More
Health:

5.5% More
Previous slide
Next slide
Cost of Living Index

92.8

Index Score

Average Mortgage

$2,102

vs Average Rent: $1,190

Housing

83.7

Index Score

Utilities

95.0

Index Score

Gas

100.2

Index Score

Median Home Sales Price

$277,500

YoY Change: 4.2%

The “Cost of Living” index score provides a comparative assessment of the relative expense involved in maintaining a standard of living in a specific area, benchmarked against a national index score of 100.

Source: COLI; BLS; Consumer Price Index for All Urban Consumers (CPI-U): Selected areas, all items index, July 2023

Market Outlook

The Omaha apartment market is holding steady, even as fundamentals in other parts of the country show signs of weakening. The forecast for Omaha’s apartment market for the upcoming year indicates positive absorption across all submarkets. Notably, the West Omaha and Sarpy County submarkets are expected to account for about 66% of the total absorption during this period. Even as market dynamics ebb and flow, the consequent effects on rental growth and occupancy rates are expected to be muted. Peering into the future, Omaha’s dependable market foundation, coupled with solid demand, signals a promising and stable horizon, irrespective of potential market volatilities.

Sources: RealPage; BLS; MSCI; The Council for Community And Economic Research (C2ER)

To Gain Further Insights Into The Omaha Market Please Reach Out To Our local Team

David Carrig

Senior Director

John Carrig

Senior Advisor