average rent
average occupancy rate
ytd sales volume
YoY rent change
yoy occupancy change
ytd individual transactions
QUARTERLY DEMAND
YTD: 767
QUARTERLY COMPLETIONS
YTD: 1,458


Following two consecutive quarters of negative absorption, property owners and operators in Omaha can now approach the future with optimism. The demand for apartments has shown a positive shift, with a total absorption of 825 units in the second quarter.
Positive absorption was observed in five out of six submarkets in Omaha. Notably, the Central Omaha submarket played a significant role, accounting for 44% of the units absorbed in this quarter.
In Q2 2023, the inventory of apartments in Omaha saw an expansion by 916 units, predominantly driven by growth in the Central Omaha submarket.
Over the last four quarters, West Omaha and Central Omaha submarkets have seen substantial growth of their apartment inventory, adding 767 and 653 units respectively.
Over the next four quarters, the Omaha-Council Bluffs apartment market is projected to see an increase in demand. According to RealPage’s forecast, approximately 2,215 units are expected to be absorbed through the second quarter of 2024, which would surpass the five-year annual average absorption rate of 1,739 units.
According to RealPage, Sarpy County and West Omaha submarkets are anticipated to become the major demand hotspots in the coming four quarters.
In Omaha, there are currently 4,176 units under construction, comprising 2.8% of the existing apartment stock. This is slightly above the historical average, but the proportion of units under construction remains manageable for Omaha operators to fill units.
Out of the units currently under construction, 2,852 are expected to be completed in the next four quarters. Most of these units are located in the West Omaha, Sarpy County, and Central Omaha submarkets.
In Q2 2023, the Kansas City apartment market experienced a resurgence in demand with renters absorbing over 1,200 net units, slightly below the seasonal average, but nonetheless highlighting the resilience of the Kansas City apartment market.
Eight out of 11 submarkets posted positive net absorption, with the South Kansas / Grandview submarket leading for absorbed units due to the opening and leasing commencement at two new Class A communities in Belton, which added 700 new units to the submarket.
Q2 2023 saw Kansas City’s apartment inventory expand by 1,240 units, with the South Kansas City / Grandview submarket contributing over half with 700 units.
This submarket’s rapid growth has caught developers’ attention. Over the past four quarters 1,372 units have been added to the submarket’s inventory, significantly outpacing the Shawnee / Lenexa / Mission submarket’s 544 units over the same time frame.
The overall Kansas City, MO-KS apartment market is projected to experience sustained demand over the next four quarters, with an anticipated absorption of 3,052 units. This underscores a steady market outlook for the upcoming period.
Central Kansas City and Olathe/Gardner submarkets are projected to be significant demand hotspots, with expected annual demands of 1,017 units and 1,031 units respectively.
The Kansas City, MO-KS apartment market is set to further expand its inventory over the next four quarters, with a substantial increase of 3,809 units projected.
The Olathe / Gardner and Central Kansas City submarkets are poised to contribute significantly to the new supply, with anticipated additions of 1,224 units and 1,094 units respectively.
Average Monthly Mortgage Payment
Average Monthly Rent
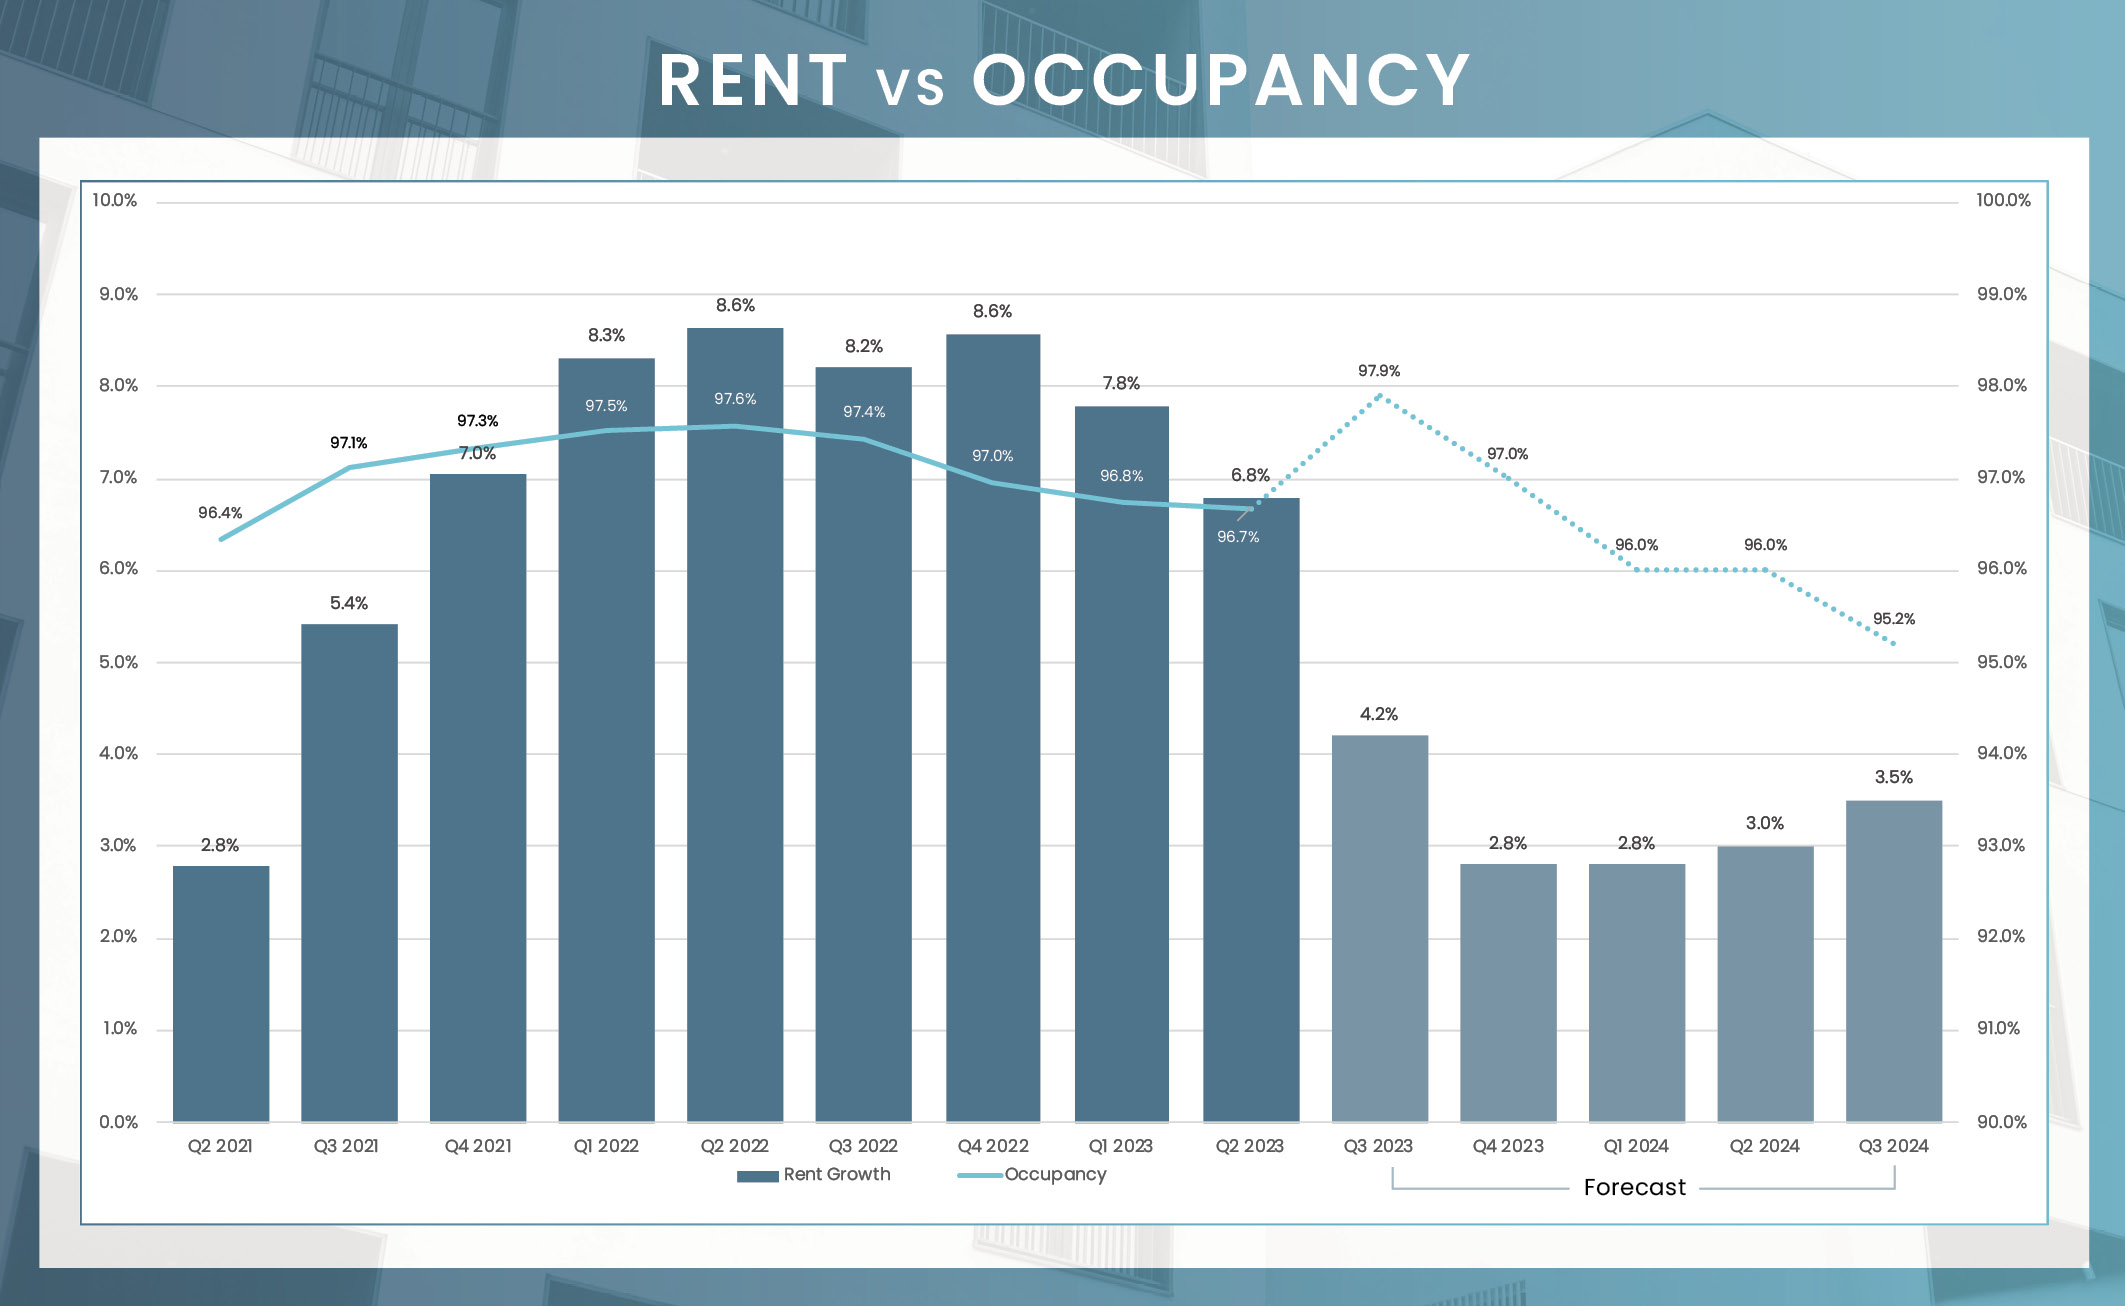
Despite experiencing a slight decrease of 90 basis points over the 12 months leading up to June 2023, occupancy rates in the Omaha apartment market remained impressively high at 96.7%. This resilience was observed even amidst a surge in new deliveries during the second quarter of the year. Furthermore, the South Omaha and Central Omaha submarkets saw improvements in occupancy over the quarter, with rates increasing by 20 and 10 basis points to reach 96.6% and 96.8% respectively. Notably, the West Omaha submarket boasted the highest occupancy rate at 97.5%.
In the second quarter of 2023, Omaha’s rental rates averaged $1,167 per month, marking a significant 6.8% increase from the previous year. Although rent growth has moderated, a trend observed in many U.S. markets, Omaha’s rate of increase continues to outperform the market’s historical average growth rate of 4.8%. Remarkably, rents in Omaha have seen a cumulative increase of 23.5% over the past three years alone. The Sarpy County submarket led the way in the second quarter with the most substantial annual rent increase at 8.9%. In contrast, the South Omaha and West Omaha submarkets reported slightly lower annual rent increases of 5.6%. Despite this, both submarkets maintained rental rates of their Class A properties above $1,500 per month, the highest in the region.
| Submarket | Average Occupancy | Annual Occupancy Change | Average Monthly Rent | Annual Rent Change |
|---|---|---|---|---|
| Central Omaha | 96.80% | 0.00% | $1,190 | 7.60% |
| Council Bluffs | 93.90% | -2.00% | $1,116 | 7.60% |
| North Omaha | 96.20% | -1.10% | $1,125 | 6.90% |
| Sarpy County | 96.60% | -0.60% | $1,200 | 8.90% |
| South Omaha | 96.60% | -1.40% | $1,126 | 5.60% |
| West Omaha | 97.50% | -0.90% | $1,205 | 5.60% |
| Omaha | 96.70% | -0.90% | $1,167 | 6.80% |
Units Under Construction
Units UC Delivering In the Next 4 Quarters
In the first half of 2023, the total volume of individual traded multifamily assets in Omaha amounted to $55.4 million, mirroring the $55.6 million recorded during the same period in 2022. As has been the trend since 2021, private buyers accounted for 100% of these transactions this year. Market pricing averaged around $116,000 per unit in the second quarter of 2023, offering a significant discount compared to the national average. Indeed, the multifamily market price in Omaha is more than 50% below the average price across the United States.
* Trailing 4Q average PPU
* Preliminary Data from RCA – Individual transaction $2.5M +
Preliminary data from the Bureau of Labor Statistics reveals that Omaha’s unemployment rate in May was 2.2%, which is below the U.S. average of 3.5%. Over the past year, employment in the metro area has grown by 1.2%, resulting in an addition of 6,200 positions. The education and health services sector witnessed the most considerable growth, adding 3,900 new jobs—a 4.9% increase. Close on its heels was the leisure and hospitality sector, which created 2,300 new roles.
May Annual Jobs Created
May 23 Employment growth
May 23 Unemployment rate
3.4% us may rate
Change from May 2022 to May 2023:
3,900
Percent Change:
4.9%
Change from May 2022 to May 2023:
2,300
Percent Change:
4.5%
Change from May 2022 to May 2023:
1,300
Percent Change:
4.1%
Change from May 2022 to May 2023:
1,000
Percent Change:
1.5%
Change from May 2022 to May 2023:
900
Percent Change:
4.9%
| Sector | Change from May 2022 to May 2023 | Percent Change |
|---|---|---|
| Education and health services | 3,900 | 4.90% |
| Leisure and hospitality | 2,300 | 4.50% |
| Mining, logging, and construction | 1,300 | 4.10% |
| Government | 1,000 | 1.50% |
| Other services | 900 | 4.90% |
| Trade, transportation, and utilities | 600 | 0.60% |
| Manufacturing | 200 | 0.60% |
| Information | -200 | -1.90% |
| Financial activities | -1,800 | -4.20% |
| Professional and business services | -2,000 | -2.80% |


Despite an influx of new units, the Omaha apartment market continues to showcase exceptional resilience. Moreover, an optimistic forecast anticipates that all submarkets will see positive demand in the coming year, thereby alleviating any concerns. Notably, the West Omaha and Sarpy County submarkets are projected to lead in absorption, with a rate of 1,469 units, which represents nearly 66% of all expected demand next year. Although market dynamics may fluctuate, their impact on rent growth and occupancy rates is anticipated to be minimal. As we look ahead, the solid market fundamentals, along with steady demand, indicate a stable long-term outlook for Omaha, even amid potential market uncertainties.