$1,143 4Q 2023
$1,192 4Q 2024
4.3%
95.7% 4Q 2023
95.5% 4Q 2024
-20 BASIS POINTS
508.4K 2023
511.9K 2024
2.3% 2023
2.6% 2024
* Please note that these employment figures have been adjusted for seasonal variations and are based on Moody’s Analytics forecast as of January 1, 2024.
** Please note that these unemployment rates are estimates that have not been adjusted for seasonal variations, and they are derived from Moody’s Analytics forecast as of January 1, 2024.
FORECASTED ABSORPTION
FORECASTED NEW SUPPLY
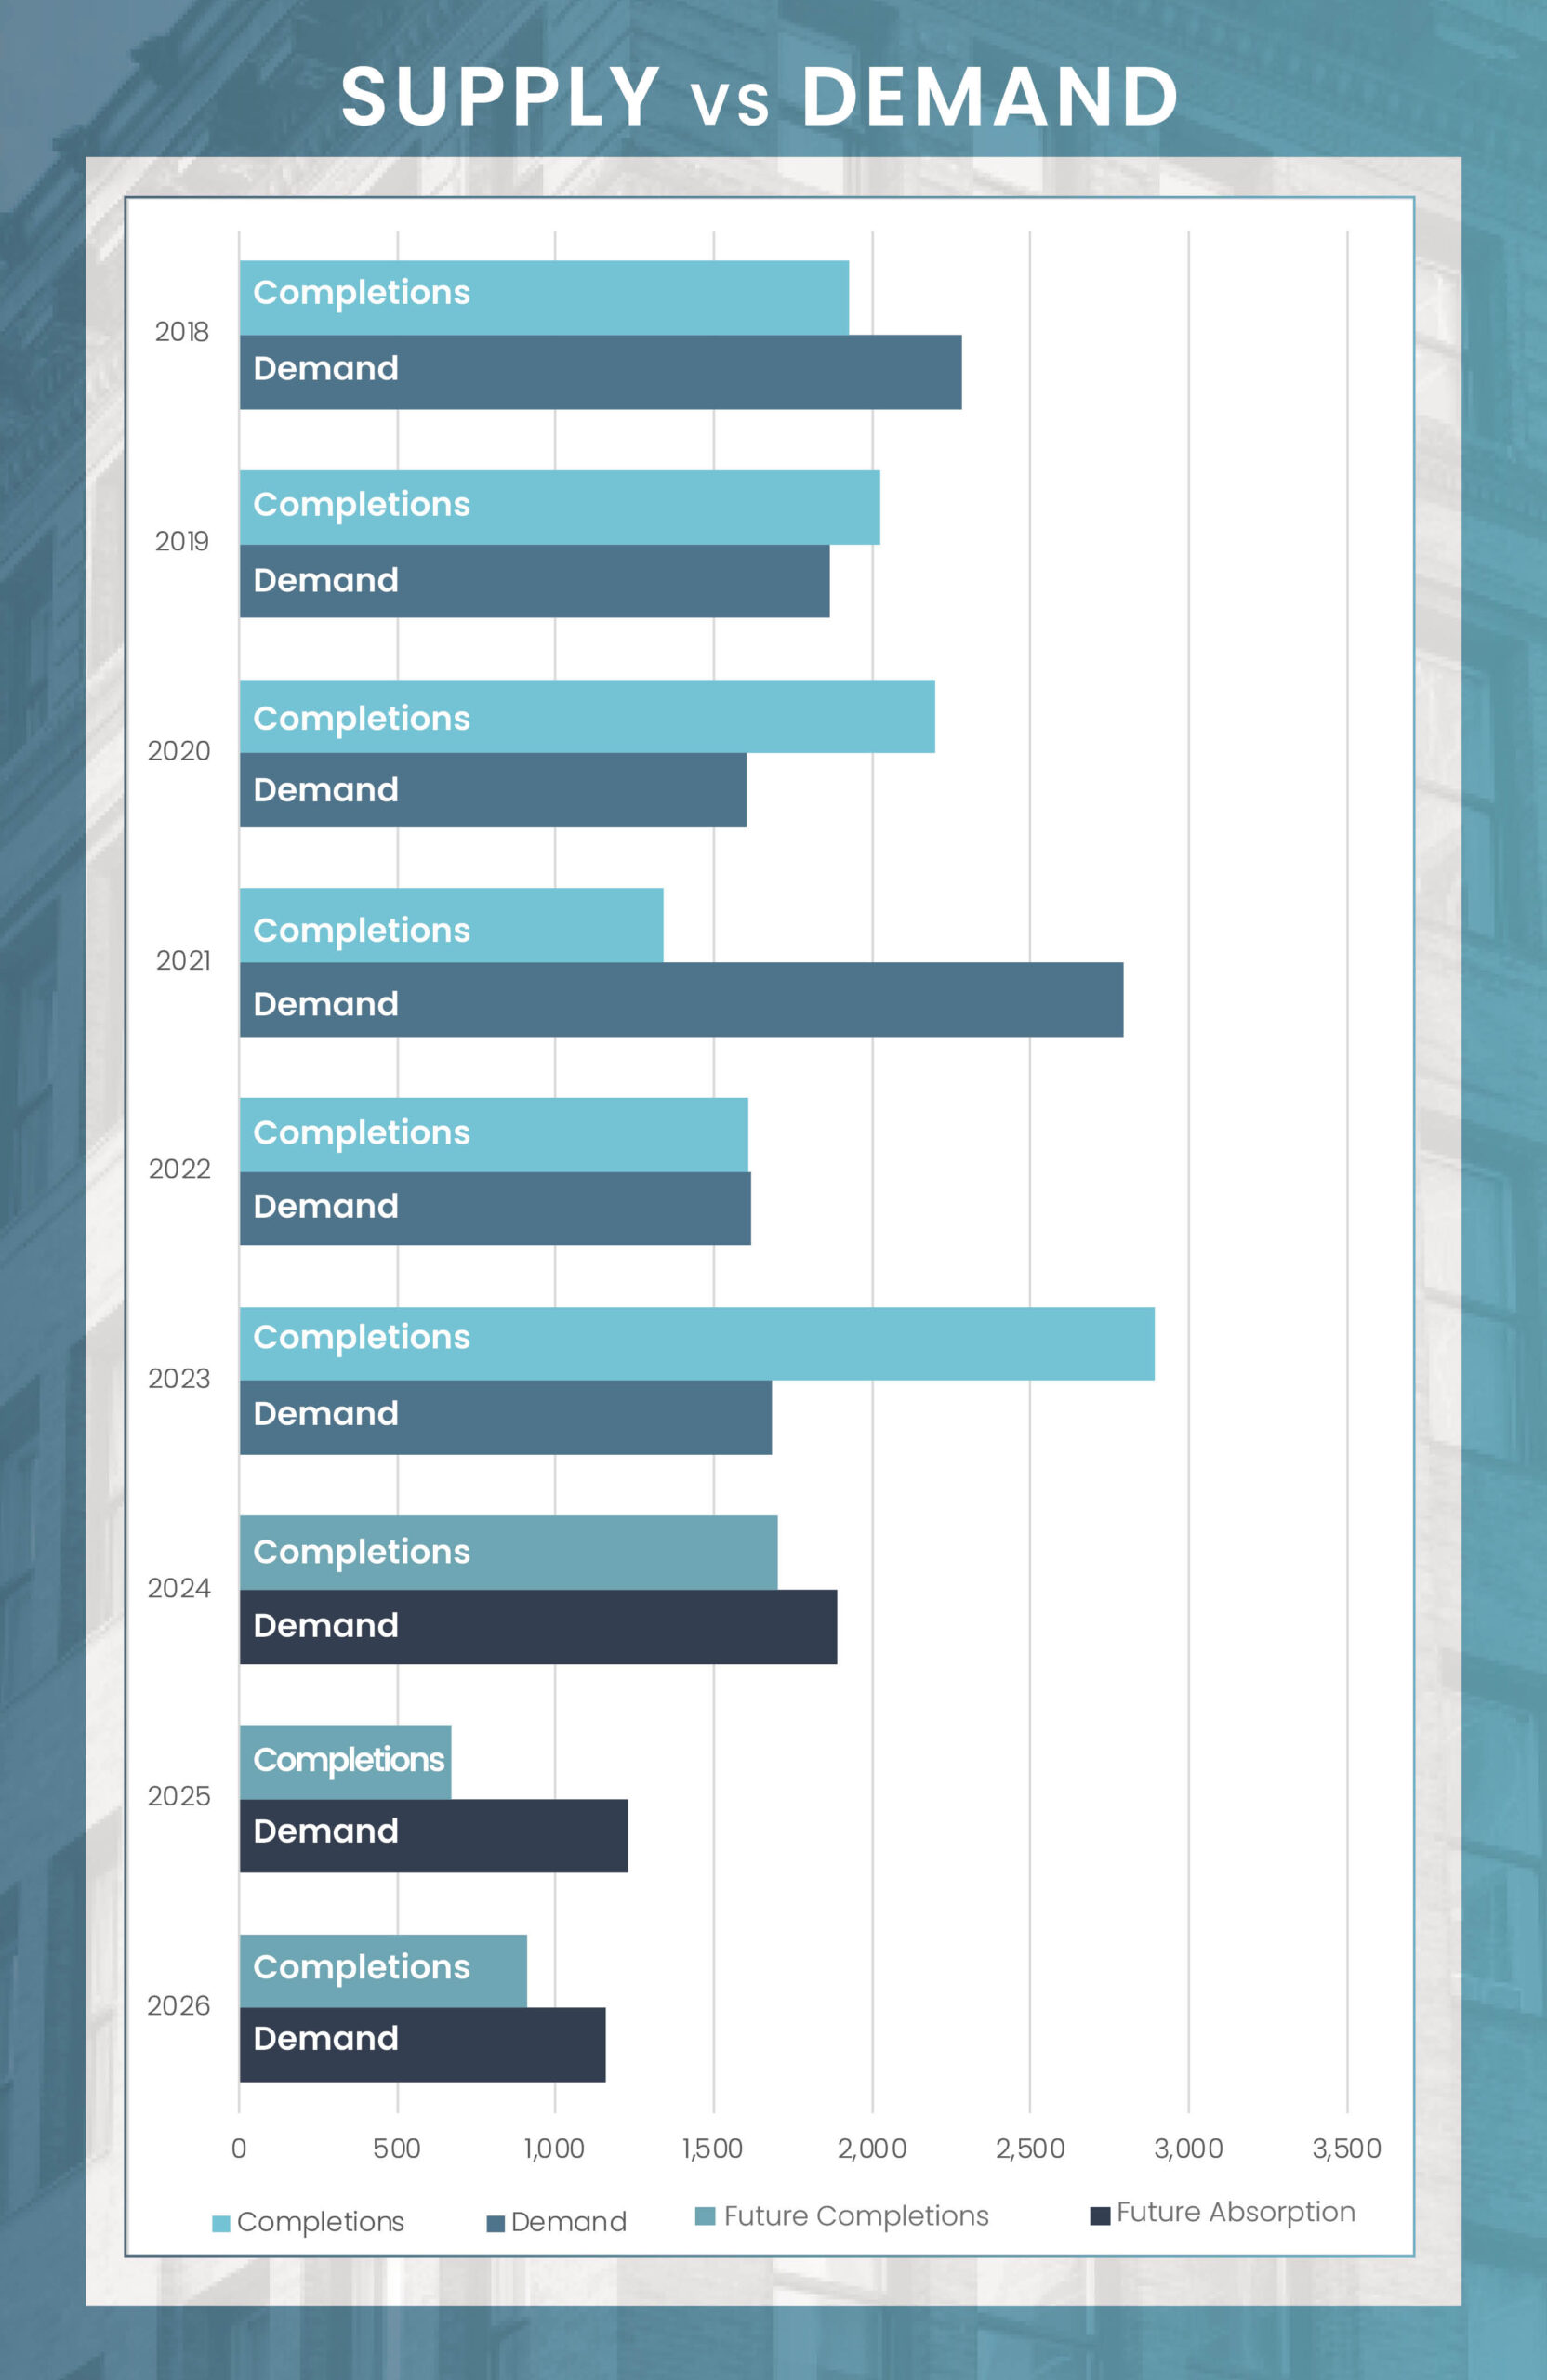
As we enter 2024, Omaha’s apartment market appears to be on the upswing following a record setting year in 2023 with regards to new supply which saw the delivery of 2,900 units. The forecast predicts a resurgence in demand alongside a significant decrease in new supply, with this year’s completions expected to drop by over 41% from last year. This shift is likely to contribute to a stabilization of occupancy rates, with occupancy holding steady at its current rate for much of the year. Supporting Omaha’s multifamily market are several positive factors, particularly its population growth which outpaces many major Midwest markets and the national average. Over the past year, Omaha’s population grew by 1.0% or 9,600 people, compared to the U.S. average of 0.4%. Omaha’s demographic trends, coupled with the expected adjustments in supply and demand dynamics, suggests a healthy future for Omaha’s multifamily market.
In 2023, Omaha’s multifamily market saw a significant surge in new unit deliveries, totaling 2,890 units, which notably surpassed the 10-year market average of around 1,750 units. Despite this uptick, the city’s construction pipeline for new units remains within a manageable scope. The current proportion of the existing inventory under construction is only 2.6%, considerably lower than the national average of about 4.7%. The development of new multifamily units is well distributed across Omaha’s 15 submarkets, ensuring a balanced growth across the city. This is evidenced by the fact that 10 of Omaha’s 15 submarkets have 100 or more units currently under construction.
Given the recent slowdown in new project starts in Omaha, it’s expected that the completion rate of new units will decrease sharply by the end of 2024. This anticipated reduction in new supply is set to pave the way for a rise in occupancy rates and an acceleration in rent growth throughout 2025. However, these positive outcomes are contingent on the broader economic environment. The multifamily market’s robust performance in 2025 hinges on the economy avoiding a recession and managing a ‘soft landing,’ a scenario where the economy slows down just enough to curb inflation without triggering a significant downturn. If these economic conditions are met, Omaha’s multifamily market is poised for a period of growth and stability.
Average Monthly Mortgage Payment
Average Monthly Rent
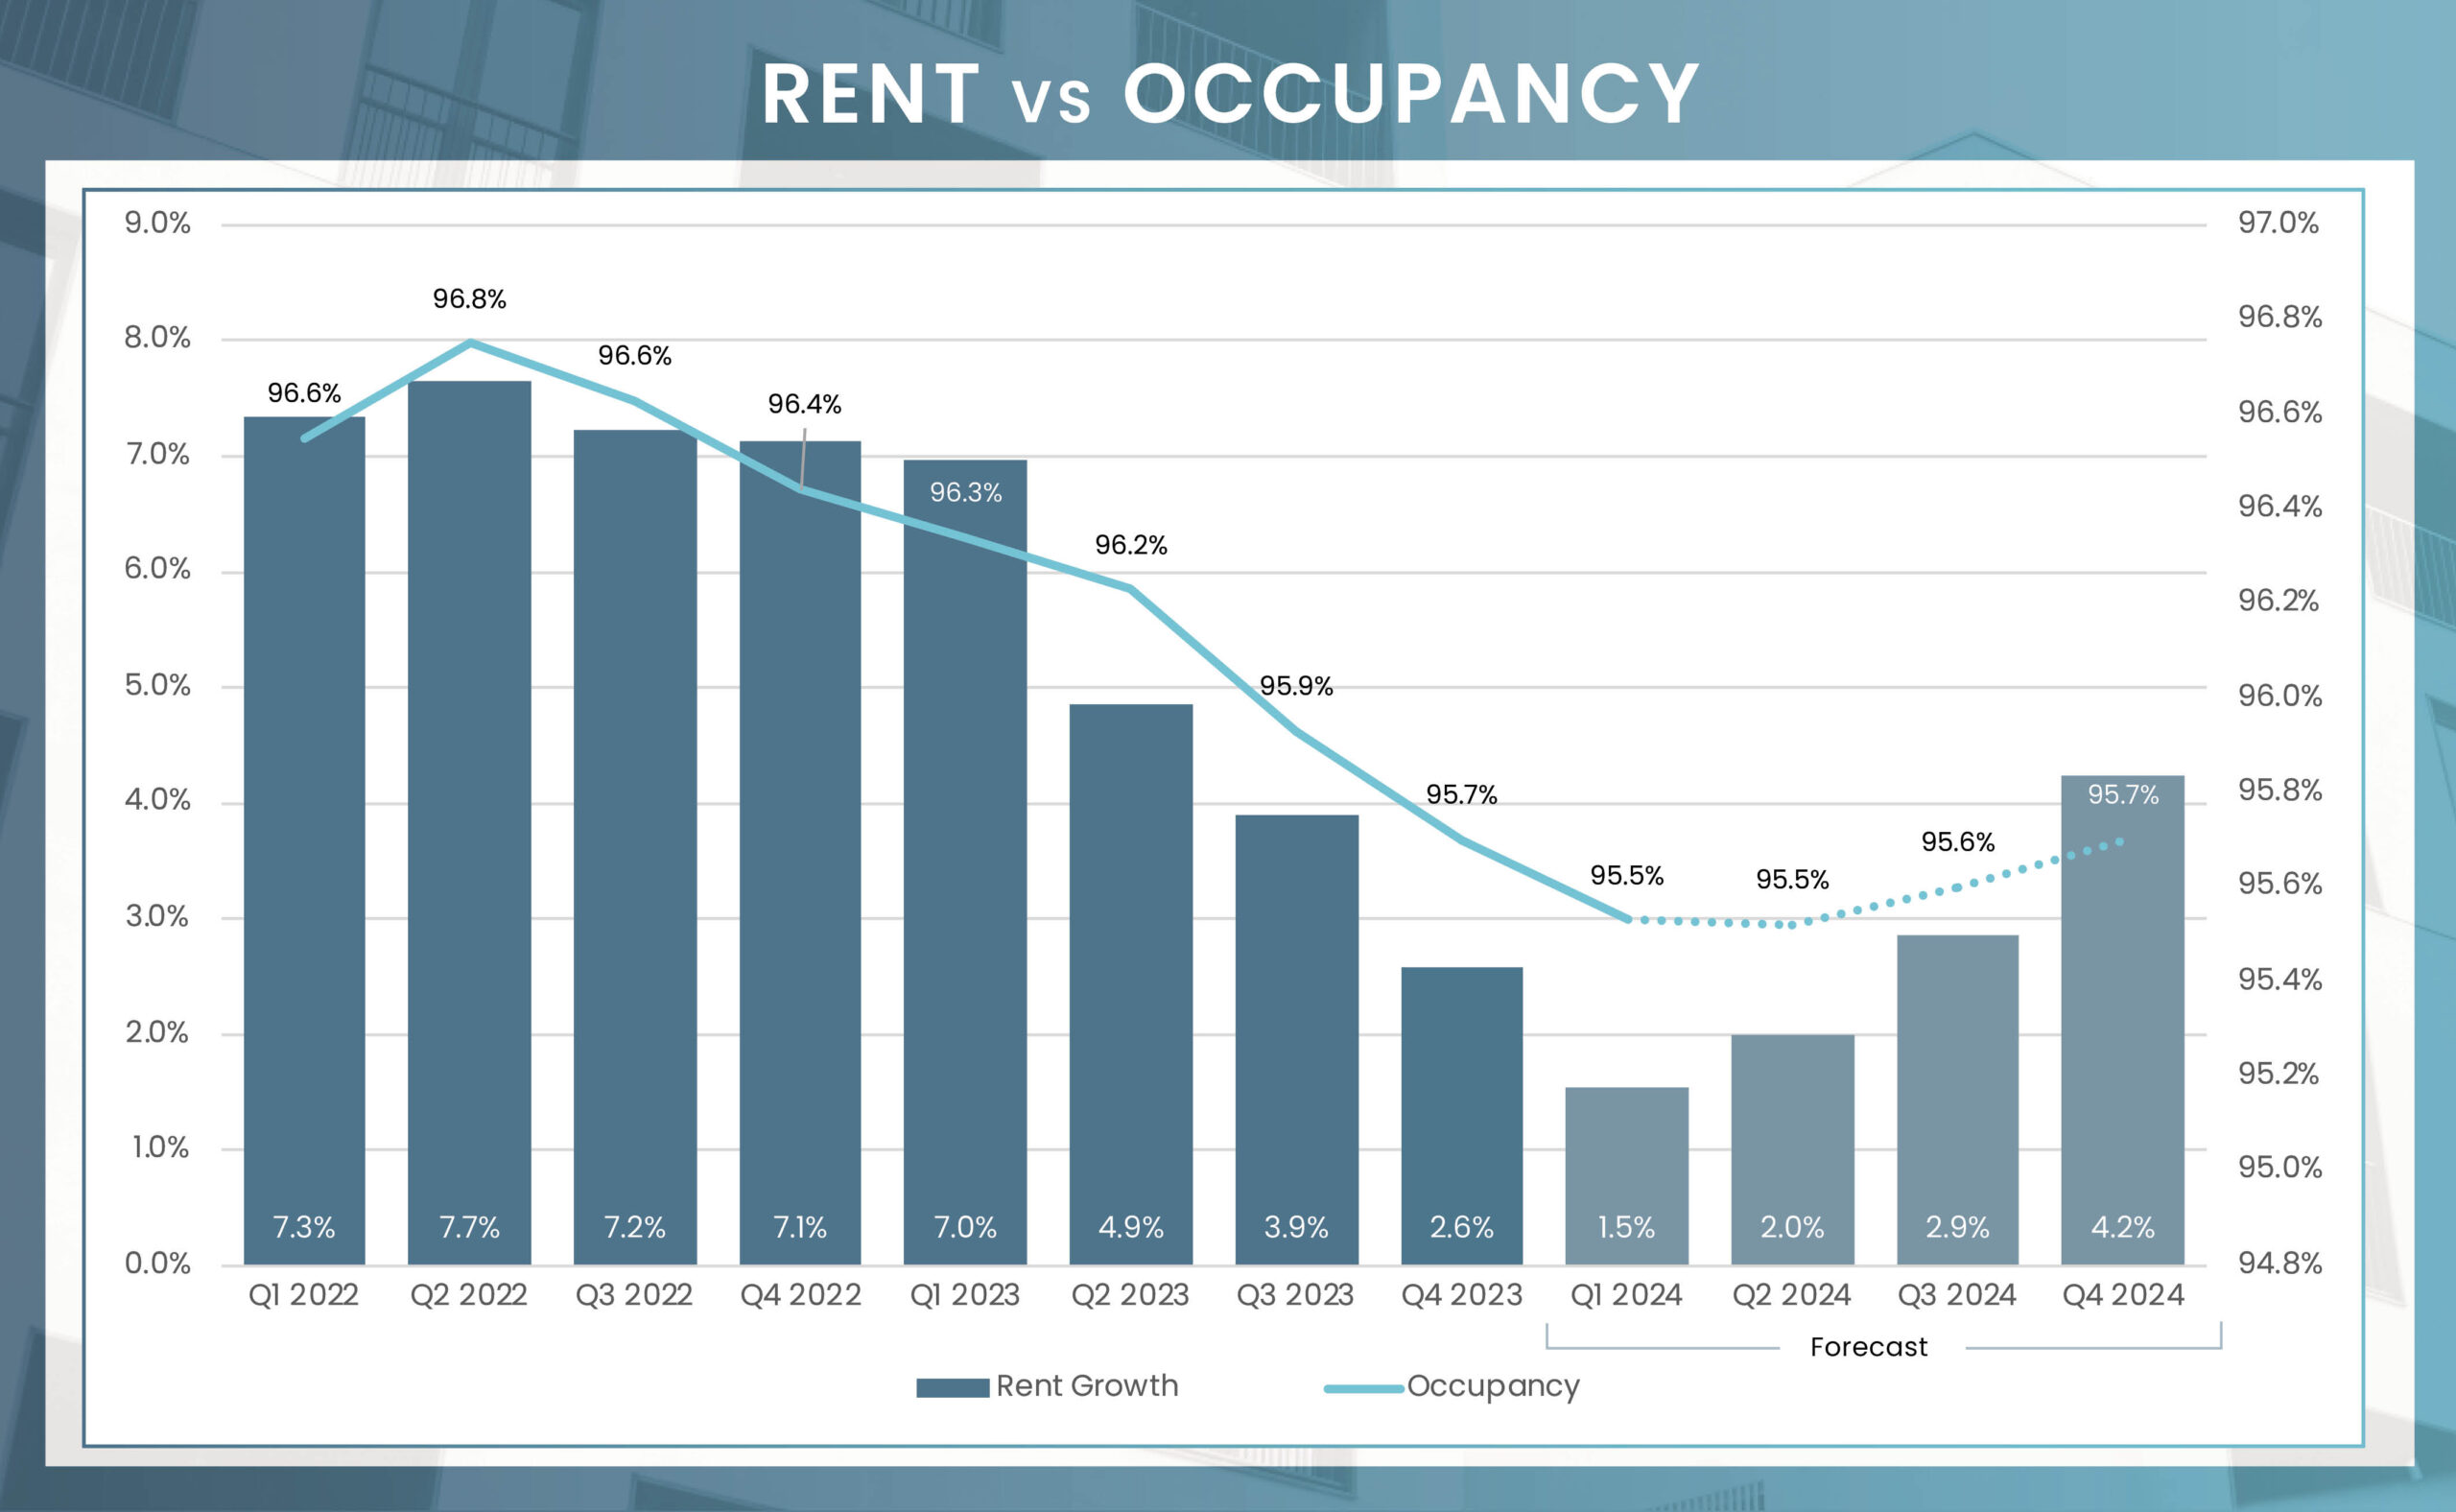
As we look into 2024, a moderation in rent growth is expected, with projections indicating a slowdown to below 2.0% in the first quarter. This trend aligns with seasonal patterns, where the colder winter months typically see reduced activity in leasing offices. However, as the warmer spring and summer leasing seasons begin in April, a steady climb in rent growth is anticipated, with a year-over-year increase expected to reach 4.2% by the end of 2024. Submarket performances are predicted to closely align with this overall market average.
The Ralston submarket, home to 5,537 units and with no new units currently under construction, is forecasted to lead in rent growth among Omaha’s submarkets, with an expected annual increase of 4.8% by the last quarter of 2024. Downtown Omaha is projected to closely follow the overall market trend with a growth rate of 4.3%. The Elkhorn submarket, despite facing the challenges of increased supply due to recent developments, is still expected to achieve a commendable annual rent increase of 3.6%. This indicates a healthy and resilient rental market in Omaha, capable of sustaining growth even amid varying supply dynamics across different submarkets.
| Submarket | Q4 2023 Stabilized Occupancy | Q4 2024 Stabilized Occupancy (f) | Annual Occupancy Change (2024/2023) | Q4 2023 Average Monthly Rent | Q4 2024 Average Monthly Rent (f) | Annual Rent Change (2024/2023) |
|---|---|---|---|---|---|---|
| Ralston | 96.0% | 95.8% | -0.2% | $988 | $1,035 | 4.8% |
| Cass County | 93.7% | 93.0% | -0.7% | $1,045 | $1,094 | 4.7% |
| Central Omaha | 95.9% | 95.7% | -0.2% | $1,069 | $1,118 | 4.6% |
| Bellevue | 95.5% | 95.5% | 0.0% | $1,190 | $1,242 | 4.4% |
| Midtown Omaha | 95.2% | 95.2% | 0.0% | $1,101 | $1,149 | 4.4% |
| Washington County | 98.4% | 98.4% | 0.0% | $905 | $944 | 4.3% |
| Millard | 97.0% | 97.0% | 0.0% | $1,215 | $1,267 | 4.3% |
| Downtown Omaha | 95.3% | 95.1% | -0.2% | $1,302 | $1,358 | 4.3% |
| West Omaha | 96.9% | 96.8% | -0.1% | $1,091 | $1,138 | 4.3% |
| Council Bluffs | 95.6% | 95.4% | -0.3% | $1,054 | $1,098 | 4.2% |
| Northwest Omaha | 95.9% | 95.7% | -0.2% | $1,231 | $1,282 | 4.2% |
| North Omaha | 93.1% | 93.0% | -0.1% | $885 | $921 | 4.1% |
| Papillion La Vista | 95.8% | 95.6% | -0.2% | $1,226 | $1,276 | 4.1% |
| Elkhorn | 97.0% | 97.0% | 0.0% | $1,368 | $1,417 | 3.6% |
| Gretna | 96.6% | 96.3% | -0.3% | $1,193 | $1,234 | 3.5% |
| Market | 95.7% | 95.7% | 0.0% | $1,143 | $1,192 | 4.3% |
4Q 2023 Unit Inventory
Number of Units Under Construction
Number of Units UC Delivering
In the Next 4 Quarters
| Submarket | Unit Inventory: 4Q 2023 | Units Under Construction | % of Existing Inventory UC | % of Total UC | Units UC Delivering In the Next 4 Quarters |
|---|---|---|---|---|---|
| Elkhorn | 5,421 | 397 | 7.3% | 19.3% | 246 |
| Papillion La Vista | 7,202 | 241 | 3.3% | 11.7% | 239 |
| Gretna | 2,633 | 182 | 6.9% | 8.8% | 181 |
| West Omaha | 7,294 | 176 | 2.4% | 8.6% | 174 |
| Downtown Omaha | 6,276 | 172 | 2.7% | 8.4% | 170 |
| Midtown Omaha | 11,535 | 205 | 1.8% | 10.0% | 159 |
| Northwest Omaha | 6,848 | 150 | 2.2% | 7.3% | 148 |
| Cass County | 208 | 120 | 57.7% | 5.8% | 119 |
| Central Omaha | 7,215 | 120 | 1.7% | 5.8% | 118 |
| Bellevue | 7,000 | 294 | 4.2% | 14.3% | 108 |
| Council Bluffs | 3,070 | 0 | 0.0% | 0.0% | 0 |
| Millard | 3,615 | 0 | 0.0% | 0.0% | 0 |
| North Omaha | 6,192 | 0 | 0.0% | 0.0% | 0 |
| Ralston | 5,537 | 0 | 0.0% | 0.0% | 0 |
| Washington County | 389 | 0 | 0.0% | 0.0% | 0 |
| Market | 80,435 | 2,057 | 2.6% | 100.0% | 1,662 |
In 2023, Omaha’s multifamily asset market experienced a downturn, with the year concluding on a subdued note as per preliminary data from MSCI. The fourth quarter saw sales volume drop to a low of $10.4 million, the weakest since 2014, contributing to an annual transaction volume of $91.7 million across 10 sales, marking a 19% decrease from the previous year. The assets traded were predominantly of lower caliber, indicated by a reduced price per unit compared to 2022. As we look to 2024, the potential stabilization or decrease in interest rates may enhance Omaha’s appeal as a multifamily investment destination in the Midwest, offering promising opportunities for savvy investors, particularly with the emergence of more attractively priced deals.
* Trailing 4Q average PPU
* Preliminary Data from RCA – Individual transaction $2.5M +
P=Preliminary
| Sector | Employment Change 2023 to 2024 | Percent Change |
|---|---|---|
| Overall Employment | 3,600 | 0.7% |
| Manufacturing | 200 | 0.6% |
| Construction | 100 | 0.3% |
| Trade, Transport., & Utilities | 700 | 0.7% |
| Information | 100 | 0.0% |
| Financial Activities | 100 | 0.5% |
| Professional & Business Services | (500) | -0.7% |
| Education & Health Services | 1,000 | 1.2% |
| Government | 500 | 0.7% |
| Leisure & Hospitality | 1,300 | 2.4% |
| Other Services | 200 | 0.5% |
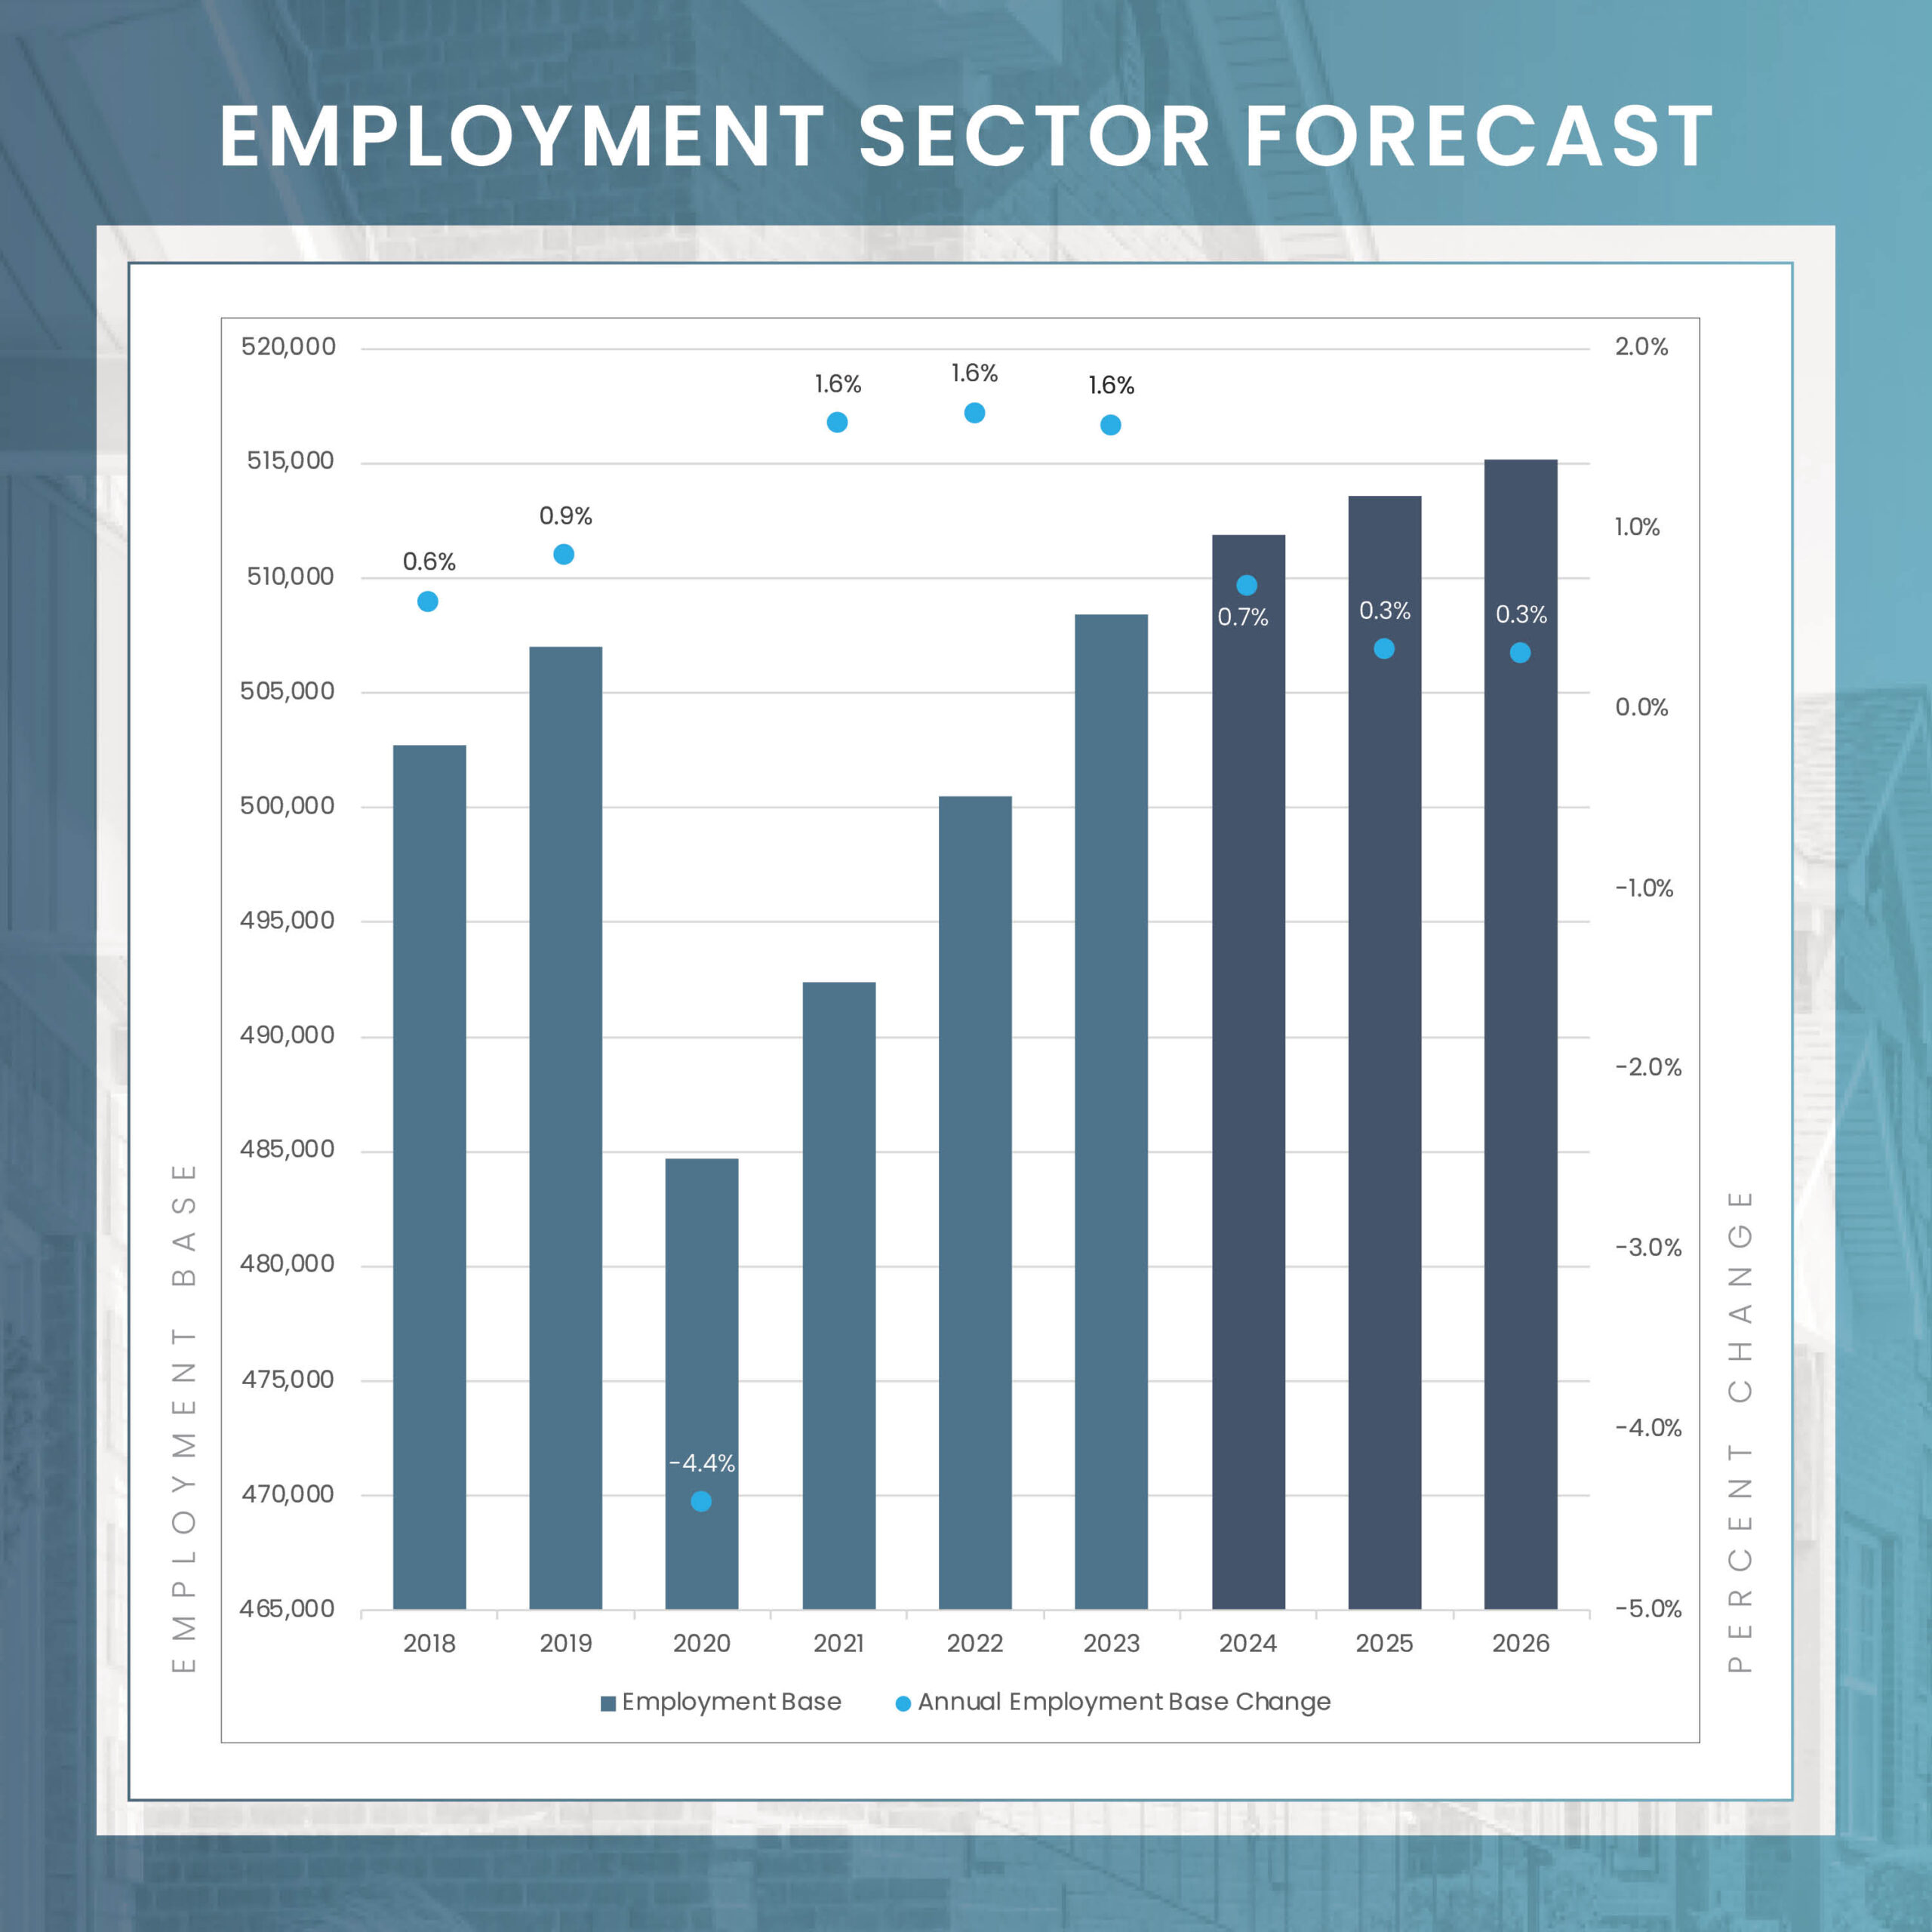
The economic forecast for Omaha in 2024 is notably optimistic, reflecting the city’s strong and diversified economic foundation. Unlike some of its regional peers, Omaha has demonstrated broad-based growth across various sectors, highlighting the city’s economic resilience and diversity. This growth is not reliant on a single industry or a few large companies, which bodes well for its stability and potential for future expansion.
A key driver of Omaha’s economic vitality is its robust job creation. The healthcare sector, a significant contributor to the local economy, is home to renowned institutions like the University of Nebraska Medical Center. In 2024, this sector is expected to see substantial growth, adding approximately 1,000 new jobs. This represents the second-largest nominal job increase in the greater Omaha area, surpassed only by the leisure and hospitality sector, which is projected to grow by 1,300 jobs.
Overall, Omaha’s economic outlook for 2024 is promising, characterized by diversified growth across key sectors. This economic landscape offers a solid foundation for sustained growth and resilience, positioning Omaha favorably both within the region and beyond.