average rent
average occupancy rate
ytd sales volume
YoY rent change
yoy occupancy change
ytd individual transactions
QUARTERLY DEMAND
YTD: -211
QUARTERLY COMPLETIONS
YTD: 564


Oklahoma City’s apartment market registered positive net absorption for the second consecutive quarter. Despite this uptick, the gains in the second and third quarters were insufficient to counterbalance the substantial number of net move-outs witnessed in the first quarter. As a result, the year-to-date net absorption rate stands at -211 units.
In Oklahoma City, five of the eight submarkets experienced positive net absorption. Leading the group was the North Central Oklahoma City submarket, where renters absorbed 186 units, outpacing the 162 units delivered within the same quarter.
In Q3 2023, the apartment inventory in Oklahoma City expanded by 264 units. Notably, this growth was solely contributed by the Intown Oklahoma City and North Central Oklahoma City submarkets.
Developers have taken a restrained approach to new apartment development in Oklahoma City compared to other sunbelt markets. Over the past five years, the market has seen an average annual inventory growth of 900 units. The peak was reached in the first quarter of 2022, with 1,700 new units coming online during the trailing four-quarter period.
RealPage projections indicate sustained demand in the overall Oklahoma City apartment market for the next four quarters. An anticipated absorption of 1,115 units signals a stable market outlook for the upcoming period.
The Northwest Oklahoma City and West Oklahoma City submarkets are poised to become significant demand drivers, with projected annual net absorption rates of 327 and 304 units, respectively.
Looking ahead, the Oklahoma City apartment market is set to grow its inventory by an additional 1,304 units over the next four quarters, marginally exceeding historical averages.
The West Oklahoma City submarket is expected to play a key role in this expansion, contributing an estimated 370 units. This represents 30% of the total units projected for delivery in the coming year.
Average Monthly Mortgage Payment
Average Monthly Rent
* The Average mortgage payment is based off a Average home sales price of $289,000 as reported by the Oklahoma City Association of Realtors as of July 2023.
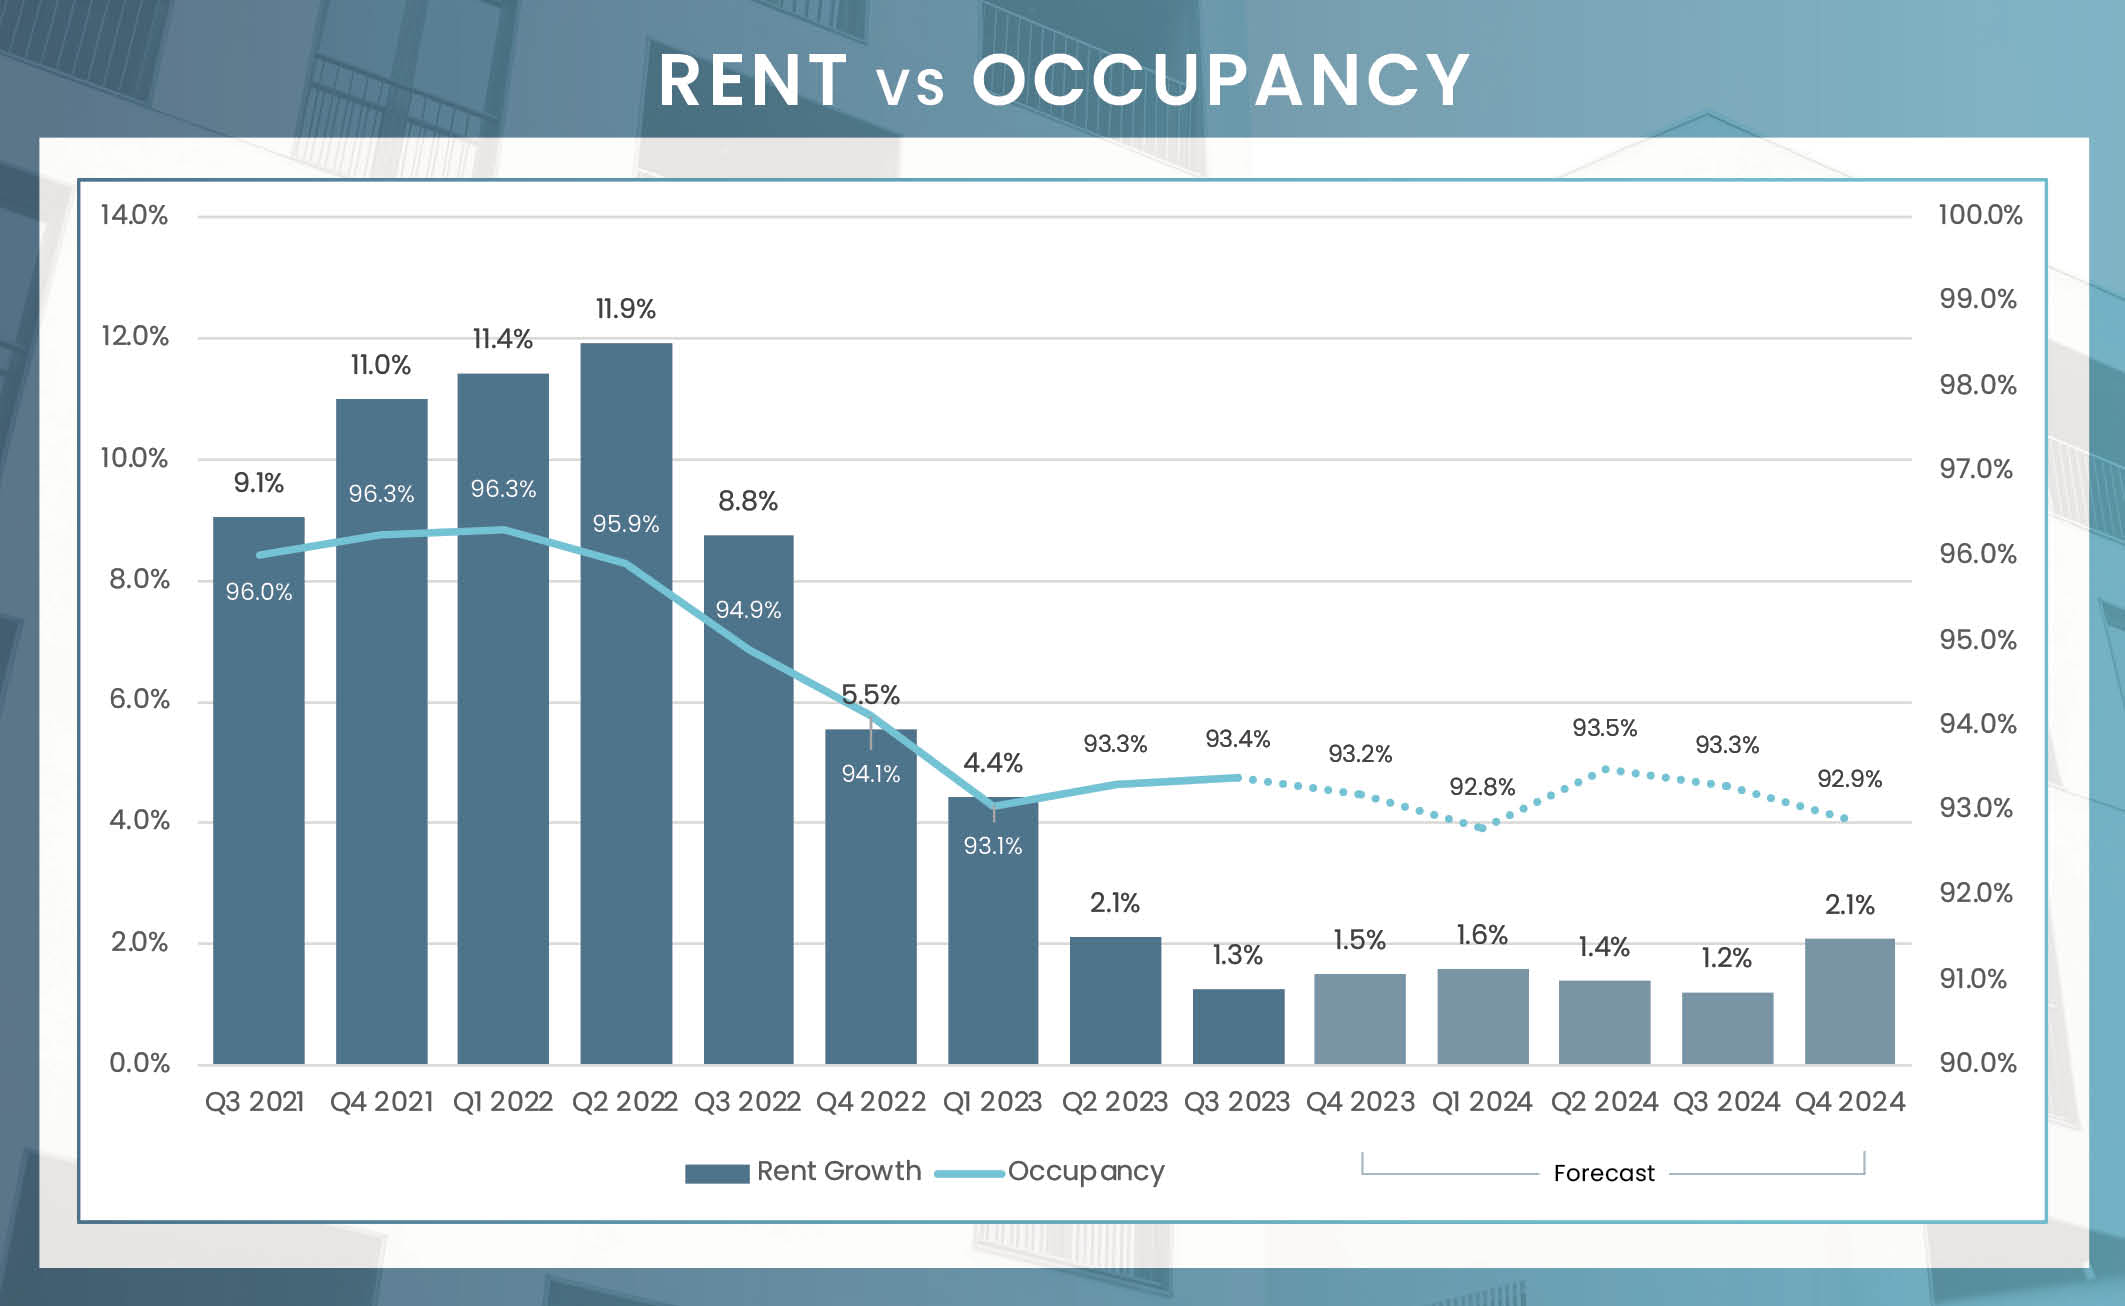
In the Oklahoma City apartment market, two successive quarters of positive net absorption led to a 10-basis point increase in the overall occupancy rate quarter-over-quarter, bringing the rate to 93.4% in the third quarter. Although this quarter’s rate is still below the level recorded last year, it is still a positive development for local owners and operators. Within asset classes, Class A properties saw notable success, with the average occupancy rate jumping 70 basis points compared to the previous quarter. In contrast, Class B properties experienced a slight dip in occupancy, declining by 20 basis points the 93.4% mark. Class C properties maintained a stable occupancy rate of 92.1%. On a submarket level, Norman / Moore led the pack with an impressive occupancy rate of 95.4%, whereas the expanding West Oklahoma City submarket lagged behind, posting the lowest rate at 90.7%.
The third quarter of 2023 marked a milestone for the Oklahoma City apartment market as average rent crossed the $1,000 threshold for the first time. Year-over-year, overall rents grew by 1.3%, resulting in an average rent of $1,006. This aligns with pre-pandemic averages for rent growth in the market, indicating a return to fundamental norms. When segmenting the market by asset class, Class C properties emerged as the top performer, registering an annual rent increase of 4.5%. This significantly outpaced the growth seen in Class A and Class B properties, which experienced increases of 1.2% and 0.1%, respectively. This trend indicates a recent shift among renters in Oklahoma City towards more cost-effective housing options. Submarket dynamics also exhibited variability. East Oklahoma City led in rent growth at 4.8%, while Intown Oklahoma City trailed with a decline of 2.4%. The lag in Intown Oklahoma City is likely attributable to heightened competition stemming from a significant inventory addition in this submarket over the past 24 months.
| Submarket | Average Occupancy | Annual Occupancy Change | Average Monthly Rent | Annual Rent Change |
|---|---|---|---|---|
| Intown Oklahoma City | 93.8% | -1.6% | $1,307 | -2.4% |
| North Central Oklahoma City | 93.8% | -1.1% | $1,067 | 0.2% |
| East Oklahoma City | 92.9% | -2.6% | $960 | 4.5% |
| Southwest Oklahoma City | 91.4% | -2.7% | $884 | 2.2% |
| West Oklahoma City | 90.7% | -2.5% | $816 | 2.9% |
| Northwest Oklahoma City | 93.4% | -1.3% | $966 | -0.3% |
| Edmond/Logan County | 94.3% | -1.8% | $1,138 | 1.3% |
| Norman/Moore | 95.4% | -0.1% | $1,007 | 3.2% |
| Oklahoma City | 93.4% | -1.5% | $1,006 | 1.3% |
Units Under Construction
Units UC Delivering In the Next 4 Quarters
Despite a decrease in the number of transactions in the first half of 2023, sales activity in Oklahoma City’s conventional multifamily property market has remained resilient. In total, 13 such properties changed hands, down from 23 during the same period last year. However, the overall volume of trades only declined by 15% compared to the first half of 2022, amounting to a preliminary total of $177.4 million for the first half of 2023.
* Trailing 4Q average PPU
* Preliminary Data from RCA – Individual conventional transaction $2.5M +
In August 2023, the Oklahoma City metro area continued to display strong employment trends, registering a net addition of 11,100 jobs as indicated by the Bureau of Labor Statistics (BLS). This growth is evident across multiple sectors. The education and health services sector led the way, contributing 5,700 new jobs, reflecting a growth rate of 5.5%. The leisure and hospitality sector followed with an addition of 3,200 jobs, amounting to a 4.2% increase. The construction sector, although more moderate in comparison, added 600 positions, marking a 1.8% growth. Oklahoma City’s consistent economic performance is highlighted by this widespread job growth across various sectors.
August Annual Jobs Created
August 23 Employment growth
August 23 Unemployment rate
3.8% us August rate
Change from Aug 2022 to Aug 2023:
5,700
Percent Change:
5.5%
Change from Aug 2022 to Aug 2023:
3,200
Percent Change:
4.2%
Change from Aug 2022 to Aug 2023:
1,300
Percent Change:
1.1%
Change from Aug 2022 to Aug 2023:
600
Percent Change:
1.8%
Change from Aug 2022 to Aug 2023:
500
Percent Change:
1.4%
| Sector | Change from August 2022 to August 2023 | Percent Change |
|---|---|---|
| Education and health services | 5,700 | 5.50% |
| Leisure and hospitality | 3,200 | 4.20% |
| Government | 1300 | 1.10% |
| Construction | 600 | 1.80% |
| Manufacturing | 500 | 1.40% |
| Financial activities | 500 | 1.40% |
| Trade, transportation, and utilities | 300 | 0.20% |
| Other services | 300 | 1.00% |
| Mining and logging | 0 | 0.00% |
| Information | -200 | -3.30% |
| Professional and business services | -600 | -0.70% |
Oklahoma City offers a markedly more affordable living landscape compared to Dallas, Texas, making it especially enticing for renters. The housing costs in Oklahoma City stand out, being 28.9% lower. Add to this the utility costs, which are 13.9% lower than in Dallas, and the overall cost benefits of residing in Oklahoma City become clear. Such affordability bolsters its allure for renters, potentially drawing those seeking financial stability during unpredictable periods.
90.2
$2,146
79.2
97.2
90.8
$289,000
The “Cost of Living” index score provides a comparative assessment of the relative expense involved in maintaining a standard of living in a specific area, benchmarked against a national index score of 100.
As we look to the latter part of 2023 and beyond, the Oklahoma City apartment market is poised for a promising phase of expansion and consistency. While some variances in absorption can be expected, apartment demand will remain steady. An expansion of inventory is projected over the upcoming four quarters, largely propelled by contributions from the West Oklahoma City submarket. While this may introduce a higher number of units to the marketplace, this surge accounts for a modest 1.3% of Oklahoma City’s existing inventory, indicating that an oversaturated market is improbable. In terms of rental prices, moderate growth is expected, likely to align with or slightly surpass historic trends. Furthermore, the metro’s employment prospects remain robust, with sectors like leisure and hospitality, and education and health services at the forefront. Given the backdrop of consistent economic advancement, measured construction growth, and positive employment trajectories, the market stands well-positioned to handle and confront any forthcoming obstacles, paving the way for enduring growth of the multifamily market.