$950 4Q 2023
$1,000 4Q 2024
5.3%
89.8% 4Q 2023
90.0% 4Q 2024
20 POINTS
685.9K 2023
690.1K 2024
2.8% 2023
3.2% 2024
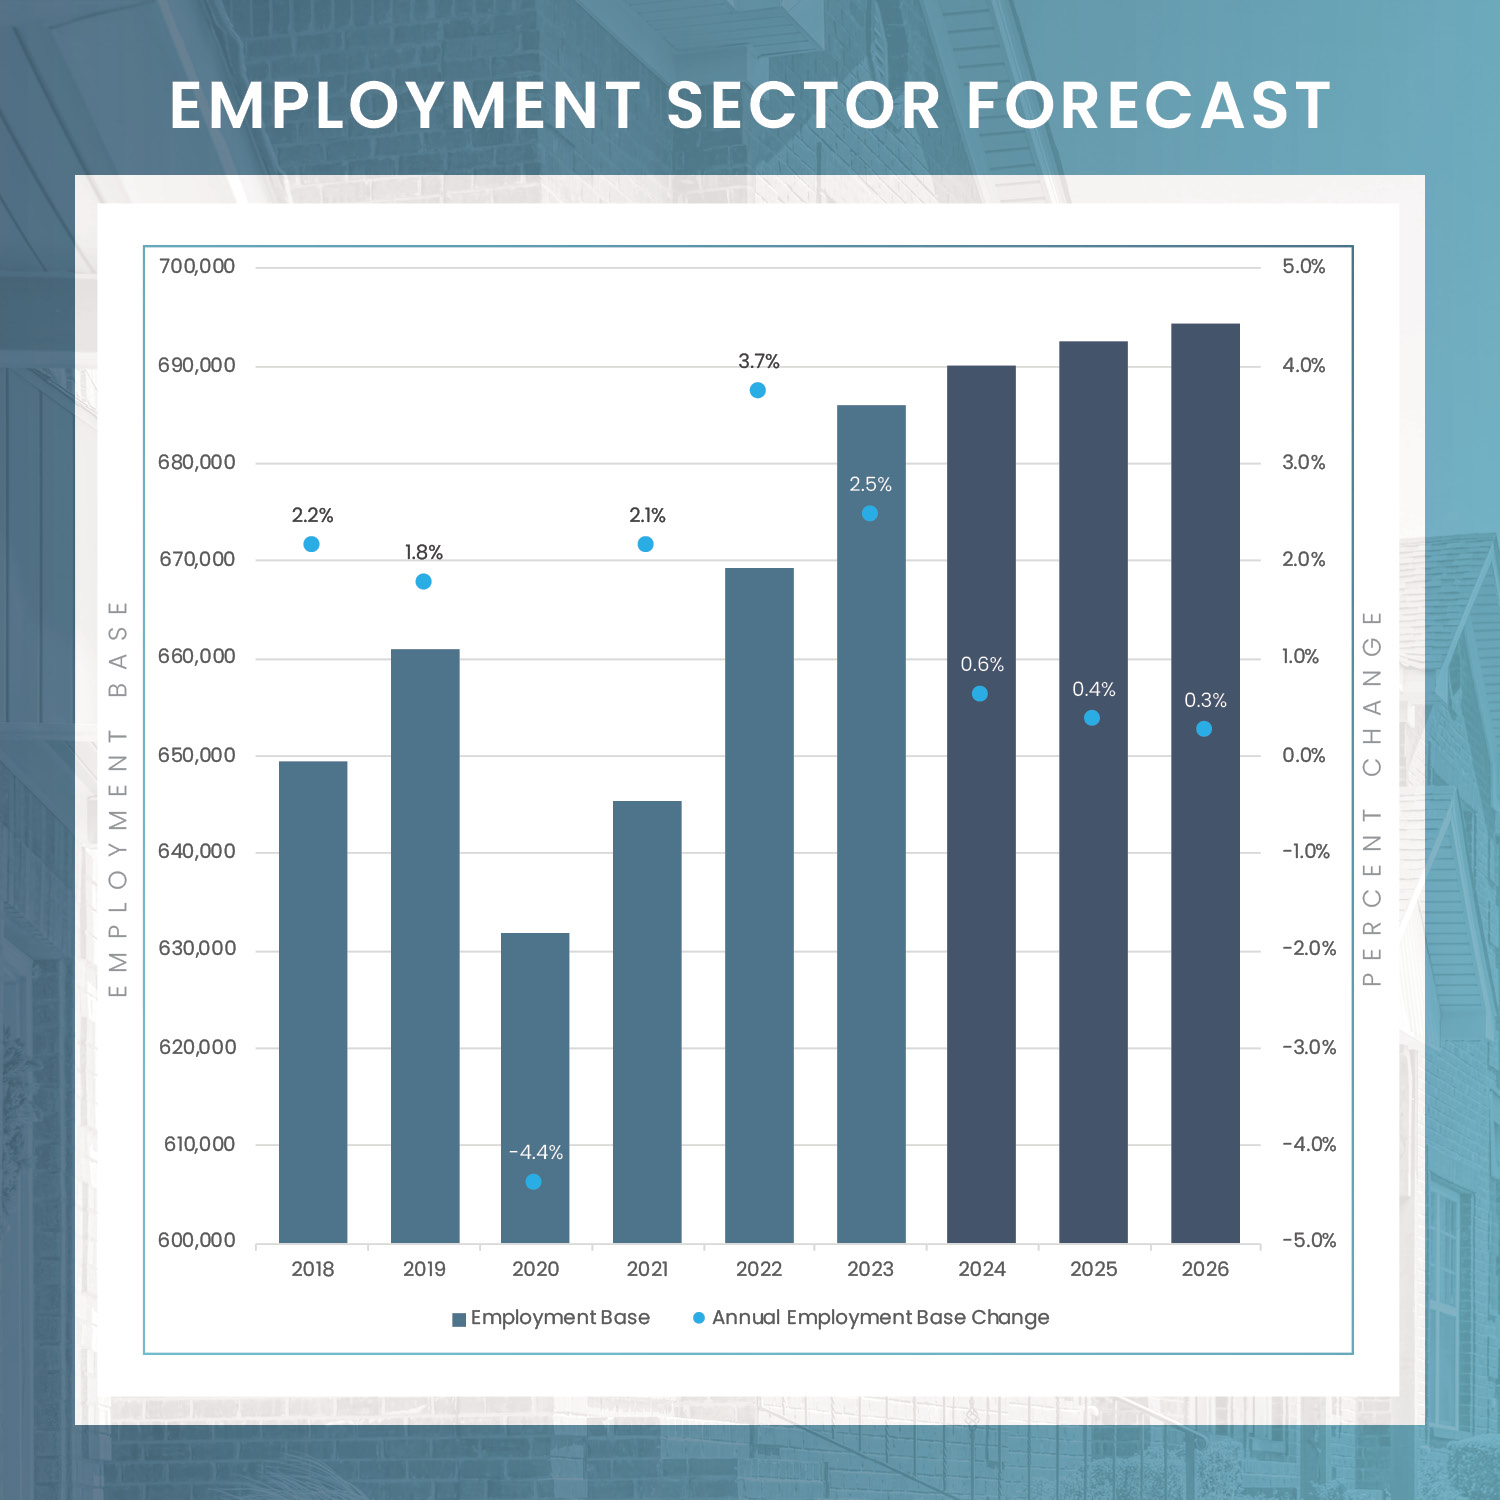
* Please note that these employment figures have been adjusted for seasonal variations and are based on Moody’s Analytics forecast as of January 1, 2024.
** Please note that these unemployment rates are estimates that have not been adjusted for seasonal variations, and they are derived from Moody’s Analytics forecast as of January 1, 2024.
Oklahoma City’s multifamily market is trending towards stabilization in 2024, with rising occupancy rates driven by strong demand in Downtown and Canadian County.
New supply in the market remains manageable, with key submarkets like Edmond, Canadian County, and Northwest Oklahoma City accounting for most new units.
Rent growth in Oklahoma City is expected to accelerate in 2024, especially in Canadian County and Norman, outperforming the broader market.
Despite a downturn in sales volume, Oklahoma City’s multifamily market is primed to see rejuvenated investor interest in 2024, supported by a positive economic outlook and sound multifamily fundamentals.
FORECASTED ABSORPTION
FORECASTED NEW SUPPLY
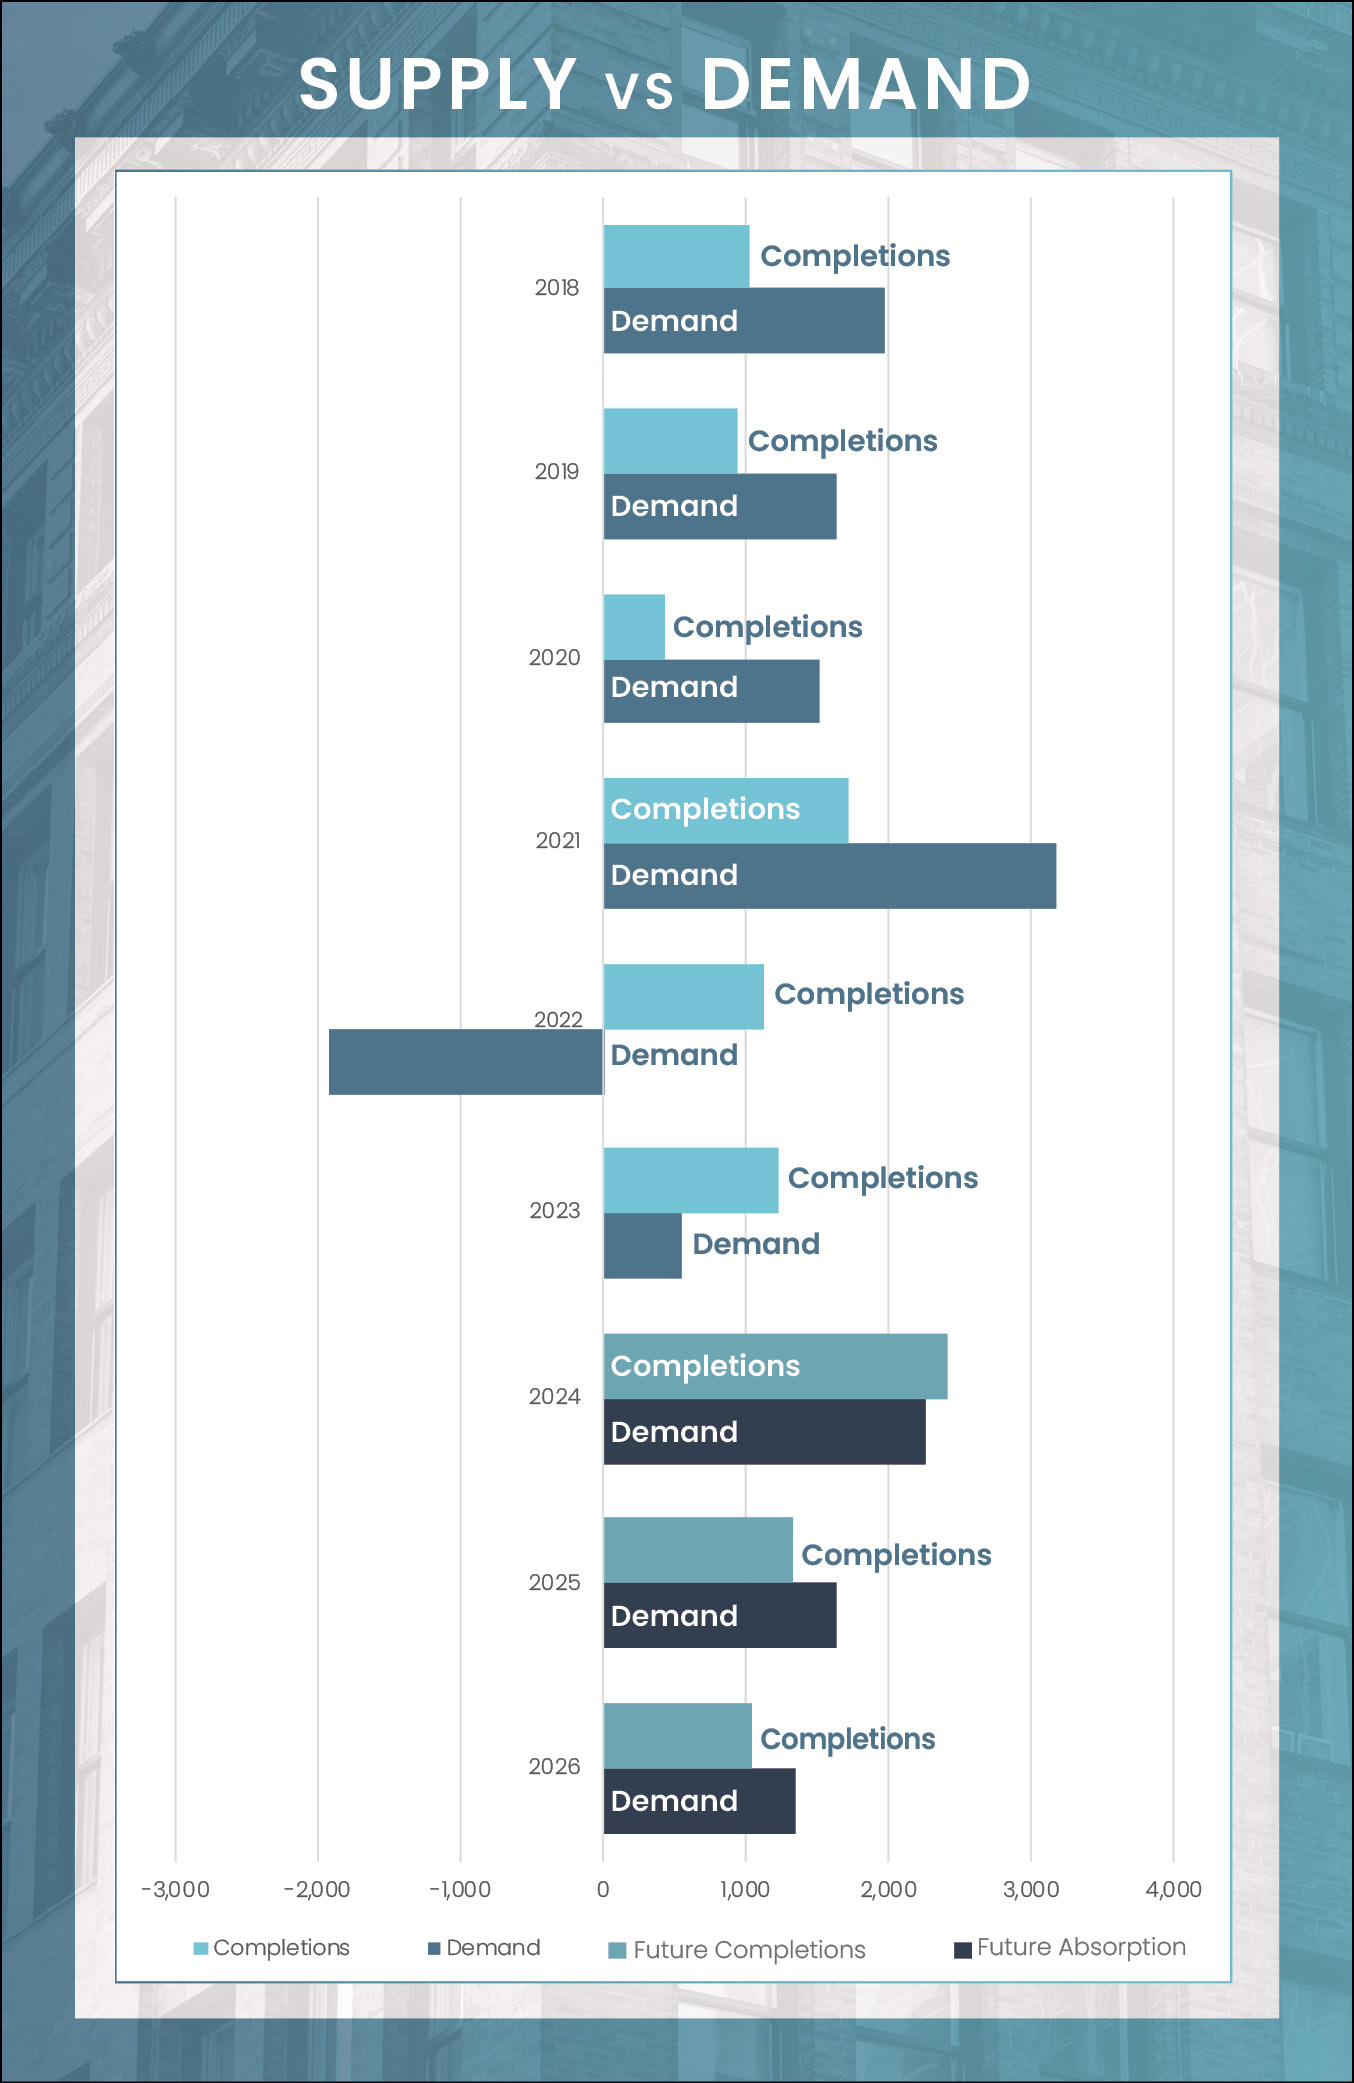
Looking ahead to 2024, the multifamily market in Oklahoma City is showing promising signs of stabilization. Over the past year, there’s been a resurgence in demand, supported by a well-managed construction pipeline. This trend is expected to maintain occupancy rates close to pre-pandemic levels. Key submarkets like Northwest and Downtown Oklahoma City have played a crucial role in this stabilization, driving the majority of net move-ins during the last year.
In Northwest Oklahoma City, a strong and vibrant renter profile is developing, marked by a younger demographic and significant population growth. This area is increasingly becoming a popular choice for renters. Concurrently, Downtown Oklahoma City is witnessing a robust resurgence in demand. Further to the west, Canadian County is rising as a new favorite among renters, buoyed by a population surge in the area.
Looking forward to the end of 2024, overall occupancy in Oklahoma City is anticipated to increase by 20 basis points, reaching 90.0%. This uptick is expected to be driven largely by robust demand in Downtown Oklahoma City and Canadian County. Both these submarkets are projected to see an even more substantial rise in occupancy, with an increase of 40 basis points each. As a result, the occupancy rate in Downtown Oklahoma City is forecasted to hit 96.1%, while Canadian County is expected to reach an occupancy rate of 93.9%.
The construction pipeline in Oklahoma City has maintained a steady pace, particularly when compared with similar markets. Over the past two years, construction starts have remained consistent. This has led to a modest increase in construction levels, with approximately 3,500 units in progress as of the first quarter of 2024, roughly 3.4% of Oklahoma City’s current apartment unit inventory. Importantly, these levels are not significant enough to adversely impact the market’s occupancy rate this year.
For 2024, there are about 2,415 new units forecasted to enter the market. A substantial portion of these deliveries is expected to be concentrated in the Edmond, Canadian County, and Northwest Oklahoma City submarkets. Combined, these three areas are poised to account for nearly 70% of the total units set to be delivered this year, while the urban core of Oklahoma City is slated to make up the majority of the remaining balance of units.
The urban core itself is undergoing considerable evolution, with several major projects in the pipeline. A particularly notable recent development, albeit still in the planning phase, is the proposed Boardwalk at Bricktown. This ambitious project, if realized, would stand as the second-tallest building in the country, surpassed only by One World Trade Center. While it’s still uncertain whether this project will move beyond the drawing board, its proposal alone is a testament to the burgeoning status of downtown Oklahoma City as a significant urban center west of the Mississippi.
Average Monthly Mortgage Payment
Average Monthly Rent
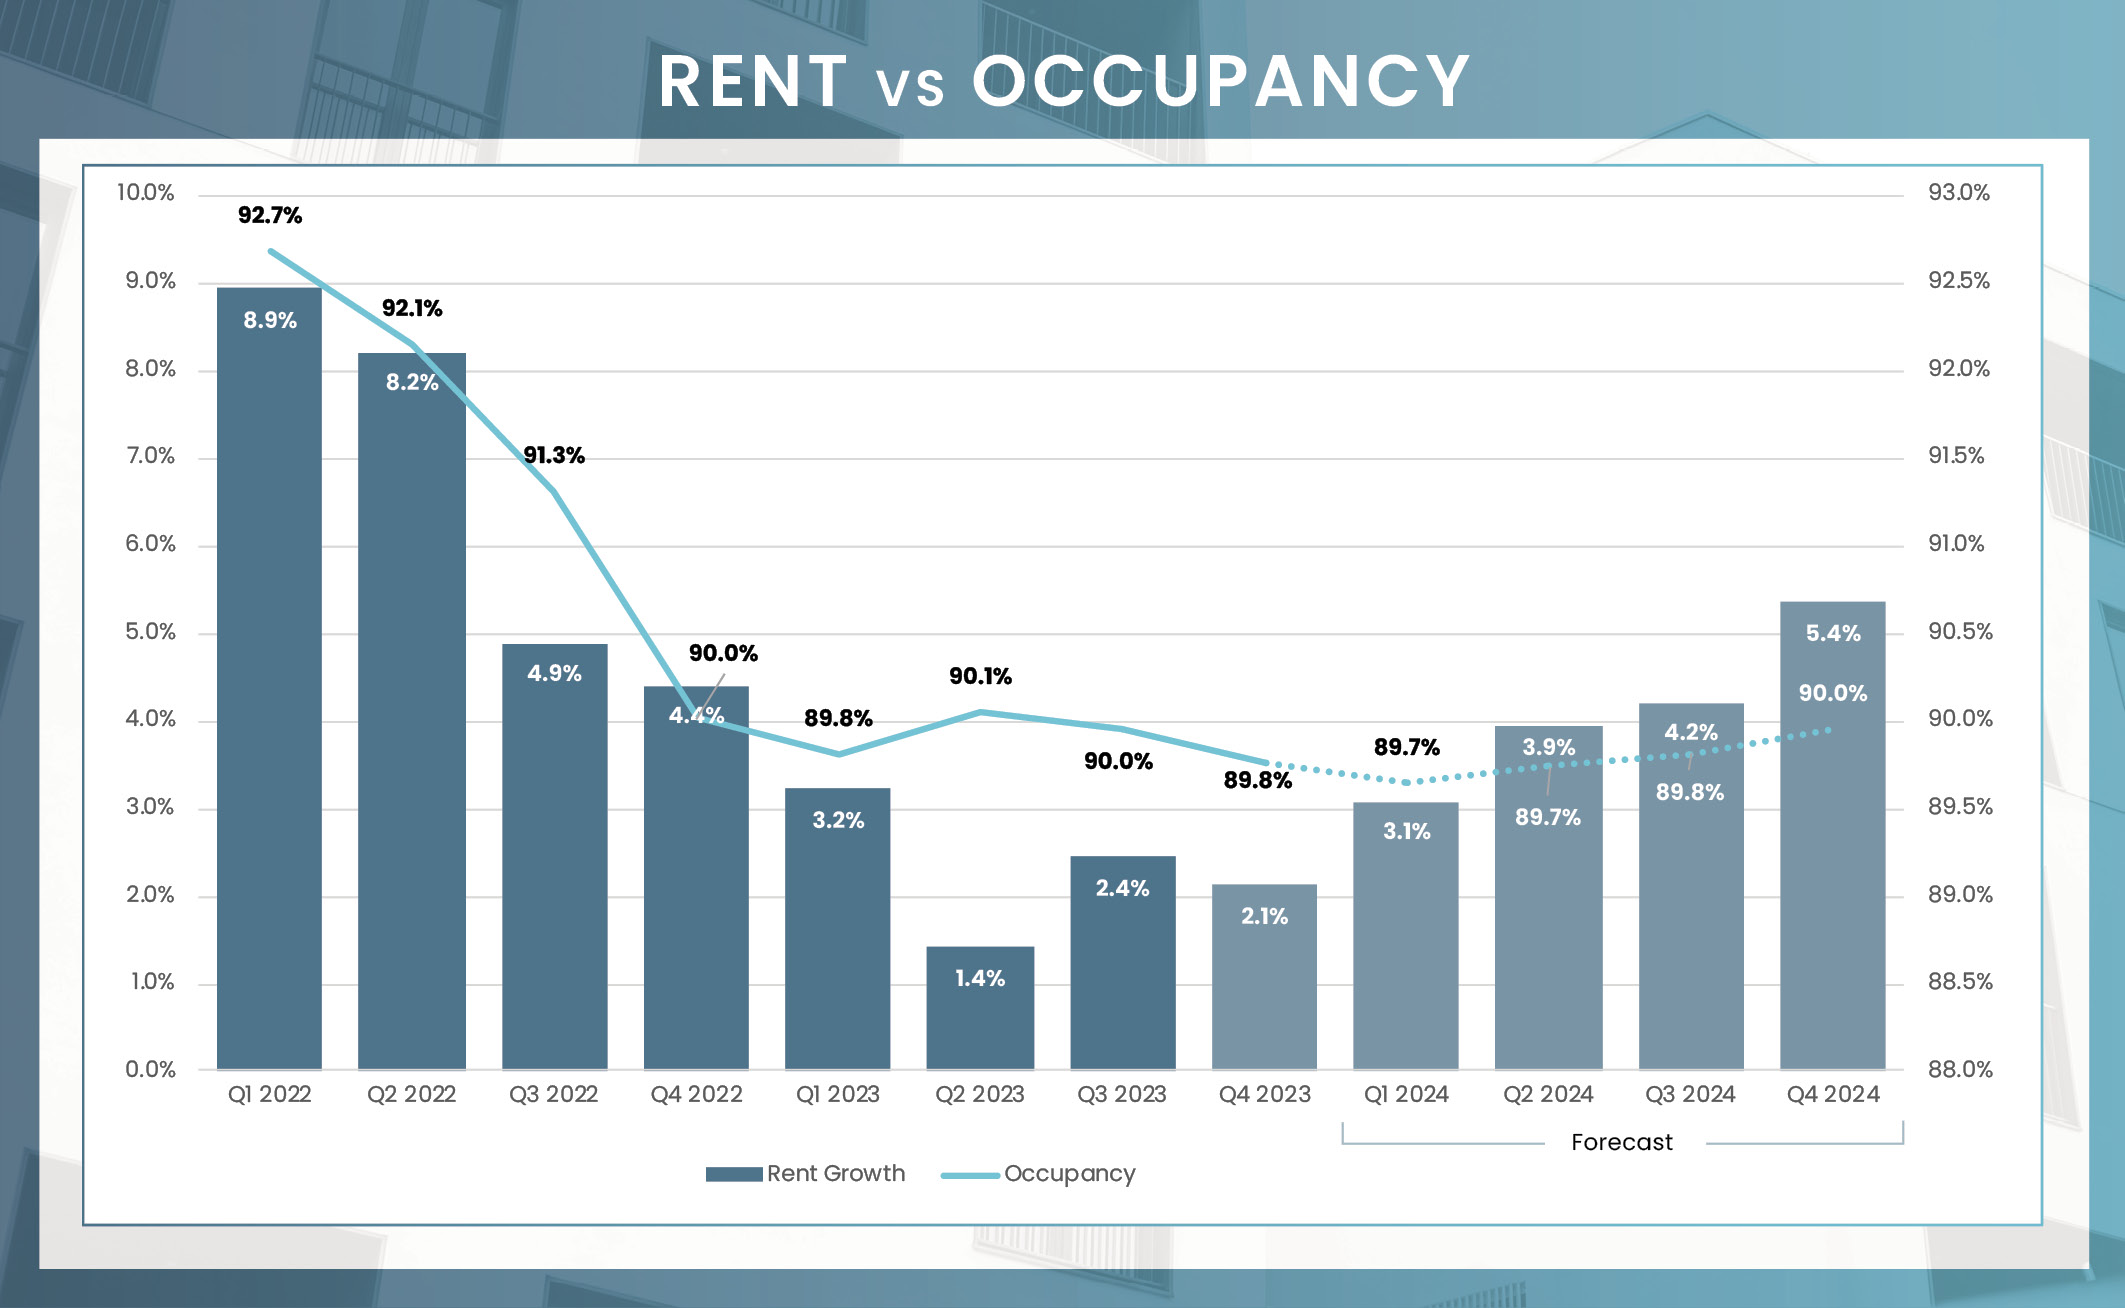
While rent growth in the Oklahoma City market has moderated over the past year, recording a 2.3% increase in the final quarter of 2023, it easily surpassed the U.S. average, which came in under one percent. As we look ahead to 2024, the outlook for rent growth in the metro appears more robust, bolstered by strong job growth in the natural resources and mining, and Health Services sectors.
By the end of 2024, rent growth in the Oklahoma City market is projected to reach 5.3%. This acceleration in rent growth is expected to be particularly pronounced in certain submarkets. Canadian County is forecasted to experience a healthy appreciation of 5.7%, while the Norman submarket is anticipated to see an even higher growth rate of 5.8%. These figures indicate a significant upswing in rental market dynamics in Oklahoma City, underpinned by strong economic drivers and regional market strengths.
| Submarket | Q4 2023 Stabilized Occupancy | Q4 2024 Stabilized Occupancy (f) | Annual Occupancy Change (2024/2023) | Q4 2023 Average Monthly Rent | Q4 2024 Average Monthly Rent (f) | Annual Rent Change (2024/2023) |
|---|---|---|---|---|---|---|
| McClain County | 95.1% | 95.3% | 0.2% | $843 | $896 | 6.3% |
| Lincoln County | 93.1% | 93.3% | 0.2% | $639 | $677 | 6.0% |
| Logan County | 96.5% | 96.6% | 0.1% | $660 | $699 | 5.9% |
| Grady County | 95.7% | 95.9% | 0.3% | $676 | $716 | 5.9% |
| Midwest City/Del City | 90.6% | 90.8% | 0.2% | $820 | $868 | 5.8% |
| Norman | 92.3% | 92.6% | 0.3% | $961 | $1,017 | 5.8% |
| Outlying Cleveland County | 89.4% | 89.5% | 0.1% | $574 | $607 | 5.7% |
| Canadian County | 95.7% | 96.1% | 0.4% | $1,052 | $1,111 | 5.7% |
| Moore | 91.6% | 91.8% | 0.3% | $976 | $1,031 | 5.7% |
| Edmond | 93.9% | 94.2% | 0.3% | $999 | $1,055 | 5.7% |
| Central Oklahoma City | 85.0% | 85.0% | 0.0% | $800 | $844 | 5.4% |
| South Oklahoma City | 86.4% | 86.5% | 0.1% | $828 | $870 | 5.2% |
| Northwest Oklahoma City | 89.7% | 90.0% | 0.2% | $1,032 | $1,085 | 5.1% |
| Downtown Oklahoma City | 93.6% | 93.9% | 0.4% | $1,398 | $1,464 | 4.7% |
| Northeast Oklahoma City | 88.9% | 89.1% | 0.1% | $1,023 | $1,067 | 4.3% |
| Market | 89.8% | 90.0% | 0.2% | $950 | $1,000 | 5.3% |
4Q 2023 Unit Inventory
Number of Units Under Construction
Number of Units UC Delivering
In the Next 4 Quarters
| Submarket | Unit Inventory: 4Q 2023 | Units Under Construction | % of Existing Inventory UC | % of Total UC | Units UC Delivering In the Next 4 Quarters |
|---|---|---|---|---|---|
| Edmond | 6,346 | 660 | 10.4% | 18.9% | 594 |
| Canadian County | 5,134 | 1,568 | 30.5% | 44.8% | 589 |
| Northwest Oklahoma City | 20,252 | 485 | 2.4% | 13.9% | 471 |
| Central Oklahoma City | 19,254 | 320 | 1.7% | 9.1% | 307 |
| Downtown Oklahoma City | 5,457 | 251 | 4.6% | 7.2% | 242 |
| Northeast Oklahoma City | 2,280 | 214 | 9.4% | 6.1% | 212 |
| Grady County | 518 | 0 | 0.0% | 0.0% | 0 |
| Lincoln County | 187 | 0 | 0.0% | 0.0% | 0 |
| Logan County | 337 | 0 | 0.0% | 0.0% | 0 |
| McClain County | 315 | 0 | 0.0% | 0.0% | 0 |
| Midwest City/Del City | 6,886 | 0 | 0.0% | 0.0% | 0 |
| Moore | 6,164 | 0 | 0.0% | 0.0% | 0 |
| Norman | 12,825 | 0 | 0.0% | 0.0% | 0 |
| Outlying Cleveland County | 86 | 0 | 0.0% | 0.0% | 0 |
| South Oklahoma City | 11,069 | 0 | 0.0% | 0.0% | 0 |
| Market | 97,110 | 3,498 | 3.6% | 100.0% | 2,415 |
Preliminary data from MSCI indicates that the sales volume for conventional multifamily assets concluded 2023 on a subdued note. While it’s common for sales to be finalized in the last days of the year and for data consolidation to take some time, it’s unlikely that any late-year surge in volume would significantly shift the overall trend. The final quarter of 2023 recorded a sales volume of only $9.16 million, the lowest for a fourth quarter in over a decade. Annual transaction volume totaled $189.1 million across 17 individual asset sales, representing a 46% decrease in dollar volume from the previous year.
Looking ahead to 2024, the outlook for multifamily investment sales in Oklahoma City is optimistic, contingent on the stabilization or reduction of interest rates. Investors, particularly those priced out of larger, more rapidly growing markets, are showing increased interest in smaller tertiary areas like Oklahoma City. These markets offer stable demand drivers and a lower barrier to entry, making them attractive investment options.
* Trailing 4Q average PPU
* Preliminary Data from RCA – Individual transaction $2.5M +
P=Preliminary
| Sector | Employment Change 2023 to 2024 | Percent Change |
|---|---|---|
| Overall Employment | 4,300 | 0.6% |
| Manufacturing | (100) | -0.3% |
| Construction | (600) | -1.8% |
| Trade, Transport., & Utilities | 200 | 0.2% |
| Information | 0 | 0.0% |
| Financial Activities | 0 | 0.0% |
| Professional & Business Services | 300 | 0.2% |
| Education & Health Services | 1,200 | 1.1% |
| Government | 2,000 | 1.6% |
| Leisure & Hospitality | 300 | 0.3% |
| Natural Resources & Mining | 1,100 | 10.1% |
| Other Services | (100) | -0.3% |
As we head into 2024, Oklahoma City’s economic outlook appears promising, buoyed by diversifying industries and robust job growth, particularly in the natural resources and mining, and health services sectors. The multifamily real estate market is expected to see renewed vigor, with rent growth projected to outpace the national average, driven by strong demand in key submarkets like Canadian County and Downtown Oklahoma City. Despite a recent dip in multifamily asset sales, investor interest remains high, especially among firms seeking opportunities in smaller, stable markets with lower entry barriers. Additionally, ongoing urban development projects are likely to enhance the city’s appeal, further solidifying Oklahoma City’s position as an emerging economic hub in the central U.S.