National 2024 Market Forecast

MARKET SNAPSHOT

AVERAGE RENT

$1,648  4Q 2023

$1,686  4Q 2024

2024 RENT CHANGE

2.3%

OCCUPANCY RATE

94% 4Q 2023

93.8% 4Q 2024

4Q 2024 OCCUPANCY CHANGE

-20 BASIS POINTS

KEY TAKEAWAYS

  • The Midwest demonstrated remarkable resilience in apartment fundamentals through 2023, driven by its affordability, steady population growth, and a more cautious approach to new construction, in contrast to the rapid expansion seen in other regions.

  • By the end of 2024, all major markets are poised for a notable rebound with positive rent increases, reversing the trend of negative growth seen in 19 key markets in late 2023.

  • A projected 25% decrease in new unit completions and an 18% increase in net absorption suggests a potential rebound in demand and rent growth, particularly if the economy remains stable.

  • While the luxury segment faces challenges due to ongoing supply concerns, the Class B segment, with a 1.6% rent increase in 2023, shows promise for demand and performance boosts, outpacing the broader U.S. average.

Supply & Demand

ABSORPTION

318.4k UNITS 2023

375.4k UNITS 2024

NEW SUPPLY

575.3k UNITS 2023

453.0k UNITS 2024

Annual Demand vs Completions

Multifamily Fundamentals Outlook

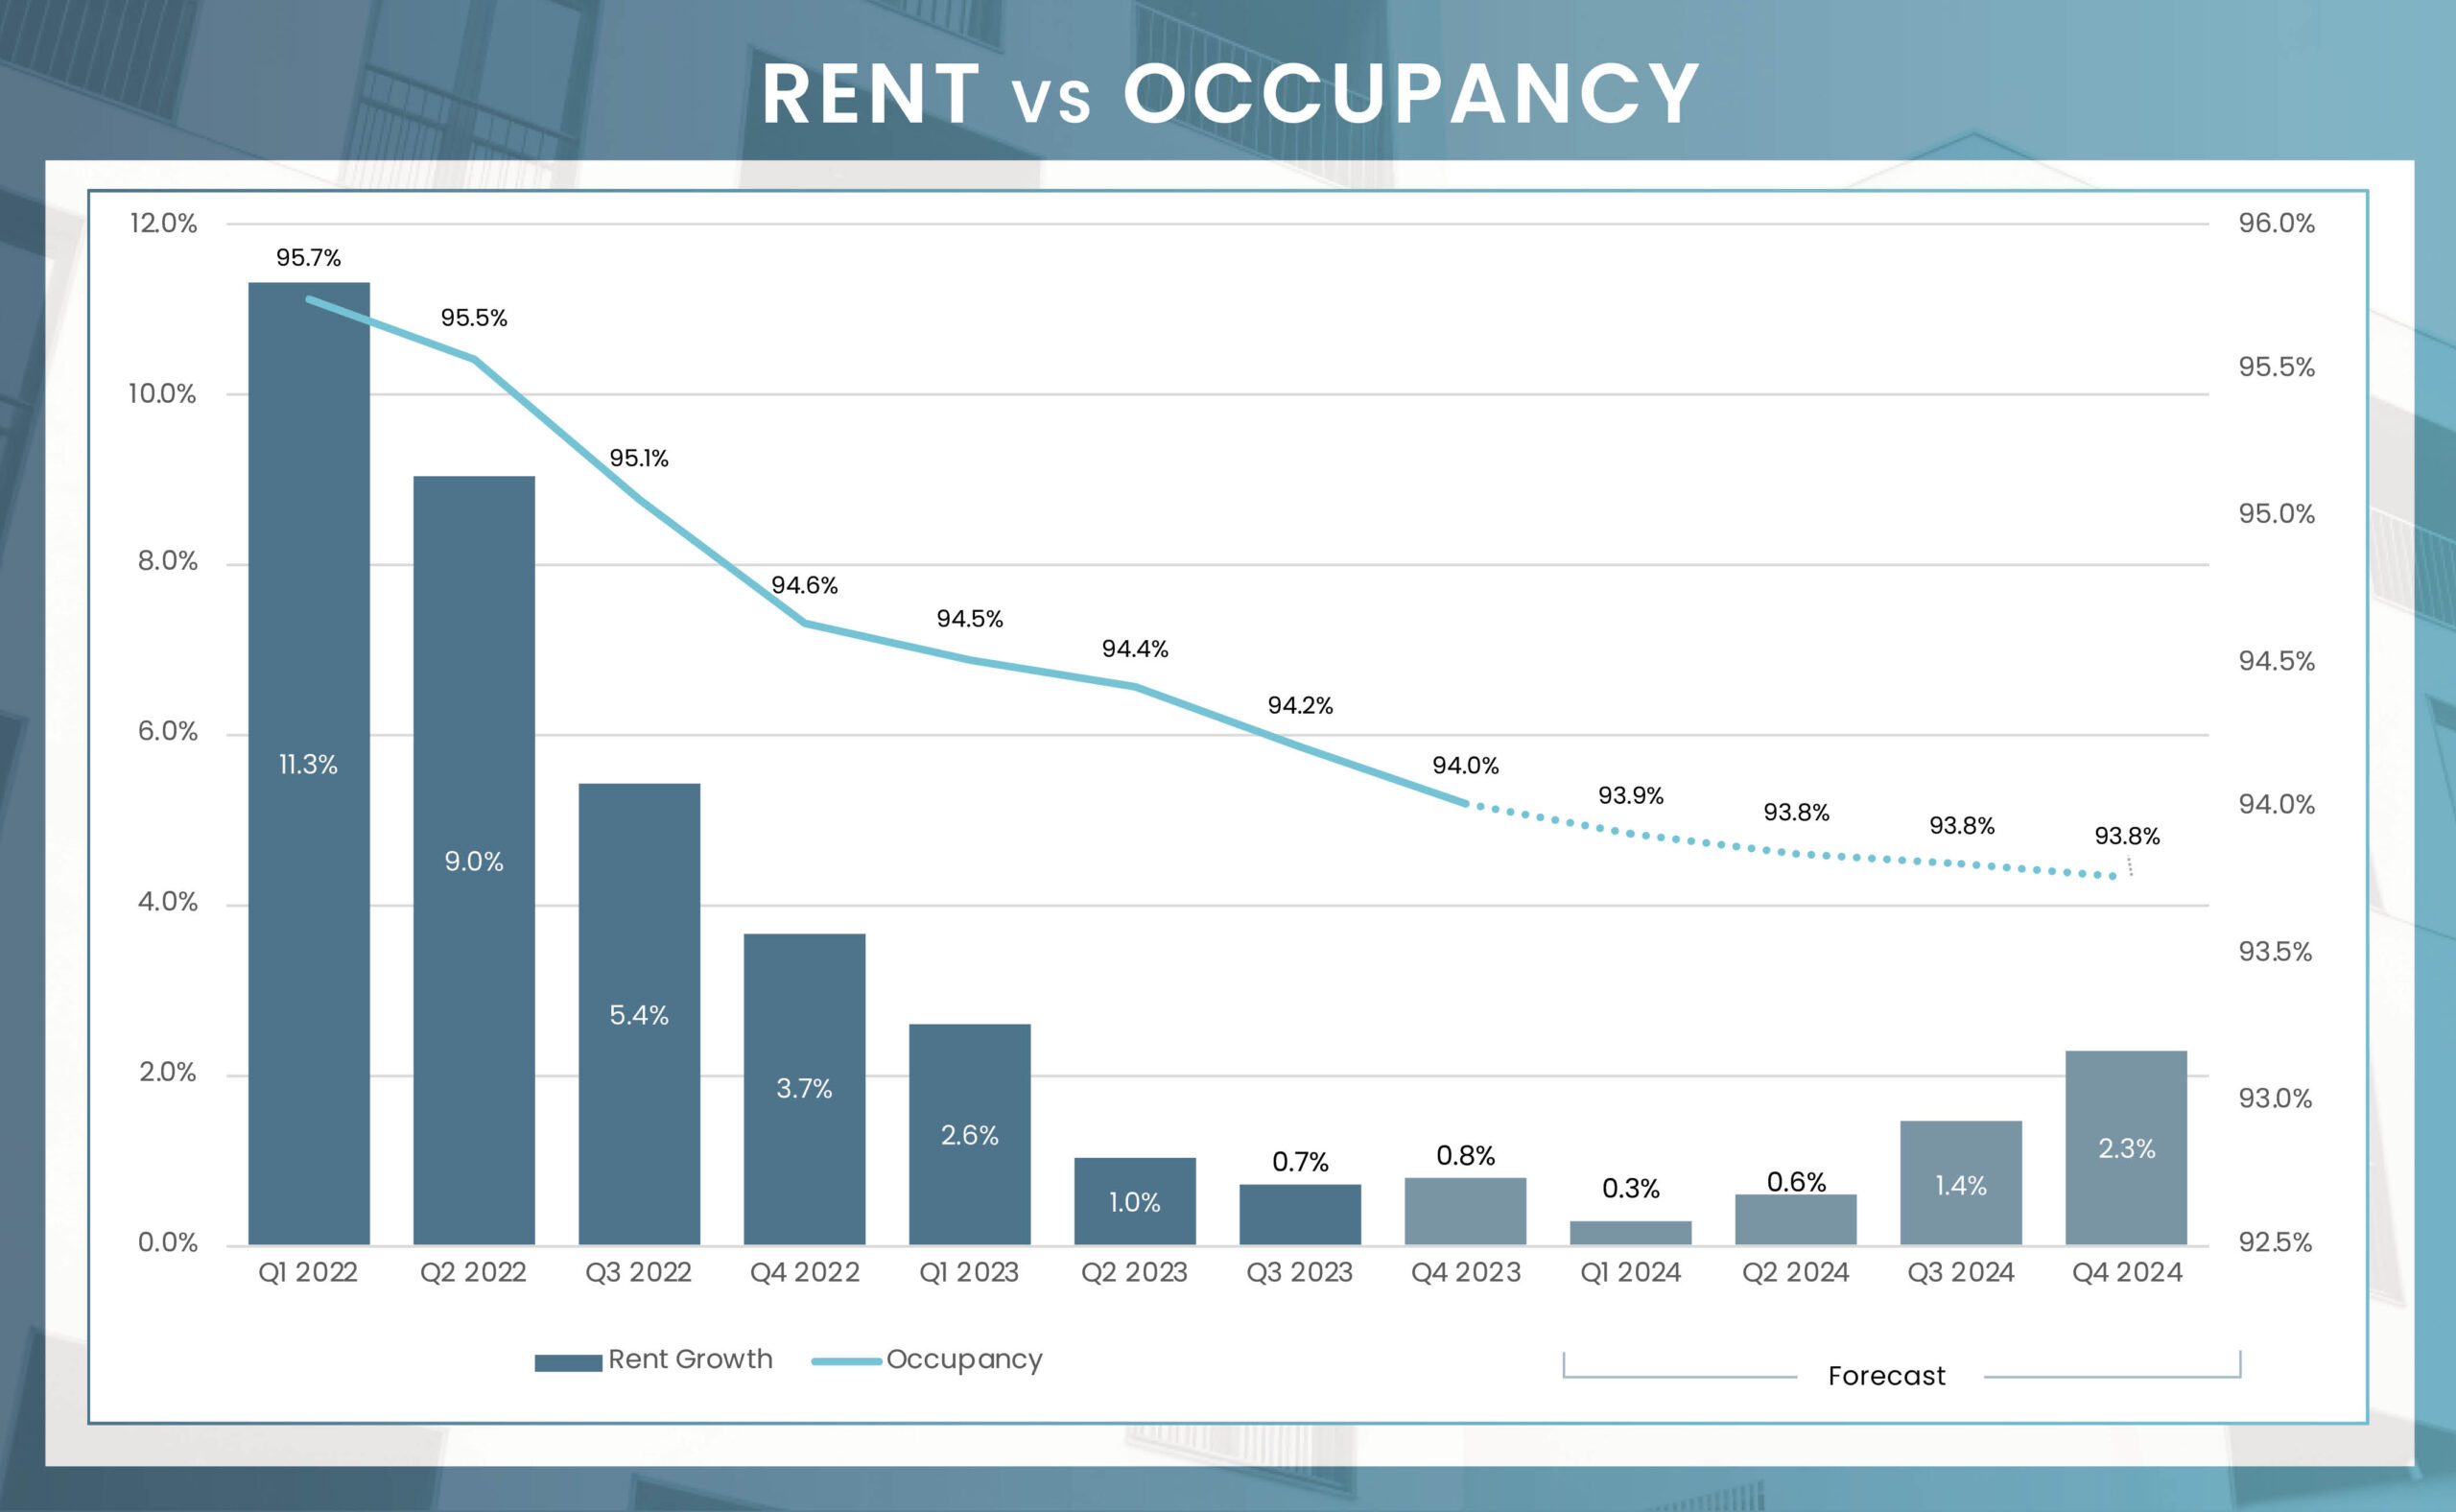
The multifamily real estate sector has undergone a significant transformation over the last couple of years. In 2022, the sector experienced unprecedented national rent increases, reaching new heights. However, by the end of 2023, the landscape had shifted considerably, with rent growth decelerating to a modest 0.8%. This change was primarily driven by a historic influx of new apartment developments coupled with a decline in demand in the latter half of 2022, exerting downward pressure on occupancy rates. Despite these dynamics at the national level, regional analyses reveal variances in performance, particularly highlighting the Midwest’s resilience in apartment fundamentals for 2023. The region’s affordability, consistent population growth, and measured pace of new construction, in contrast to the explosive growth in the Southeast and Southwest, laid the groundwork for sustained rent increases last year.

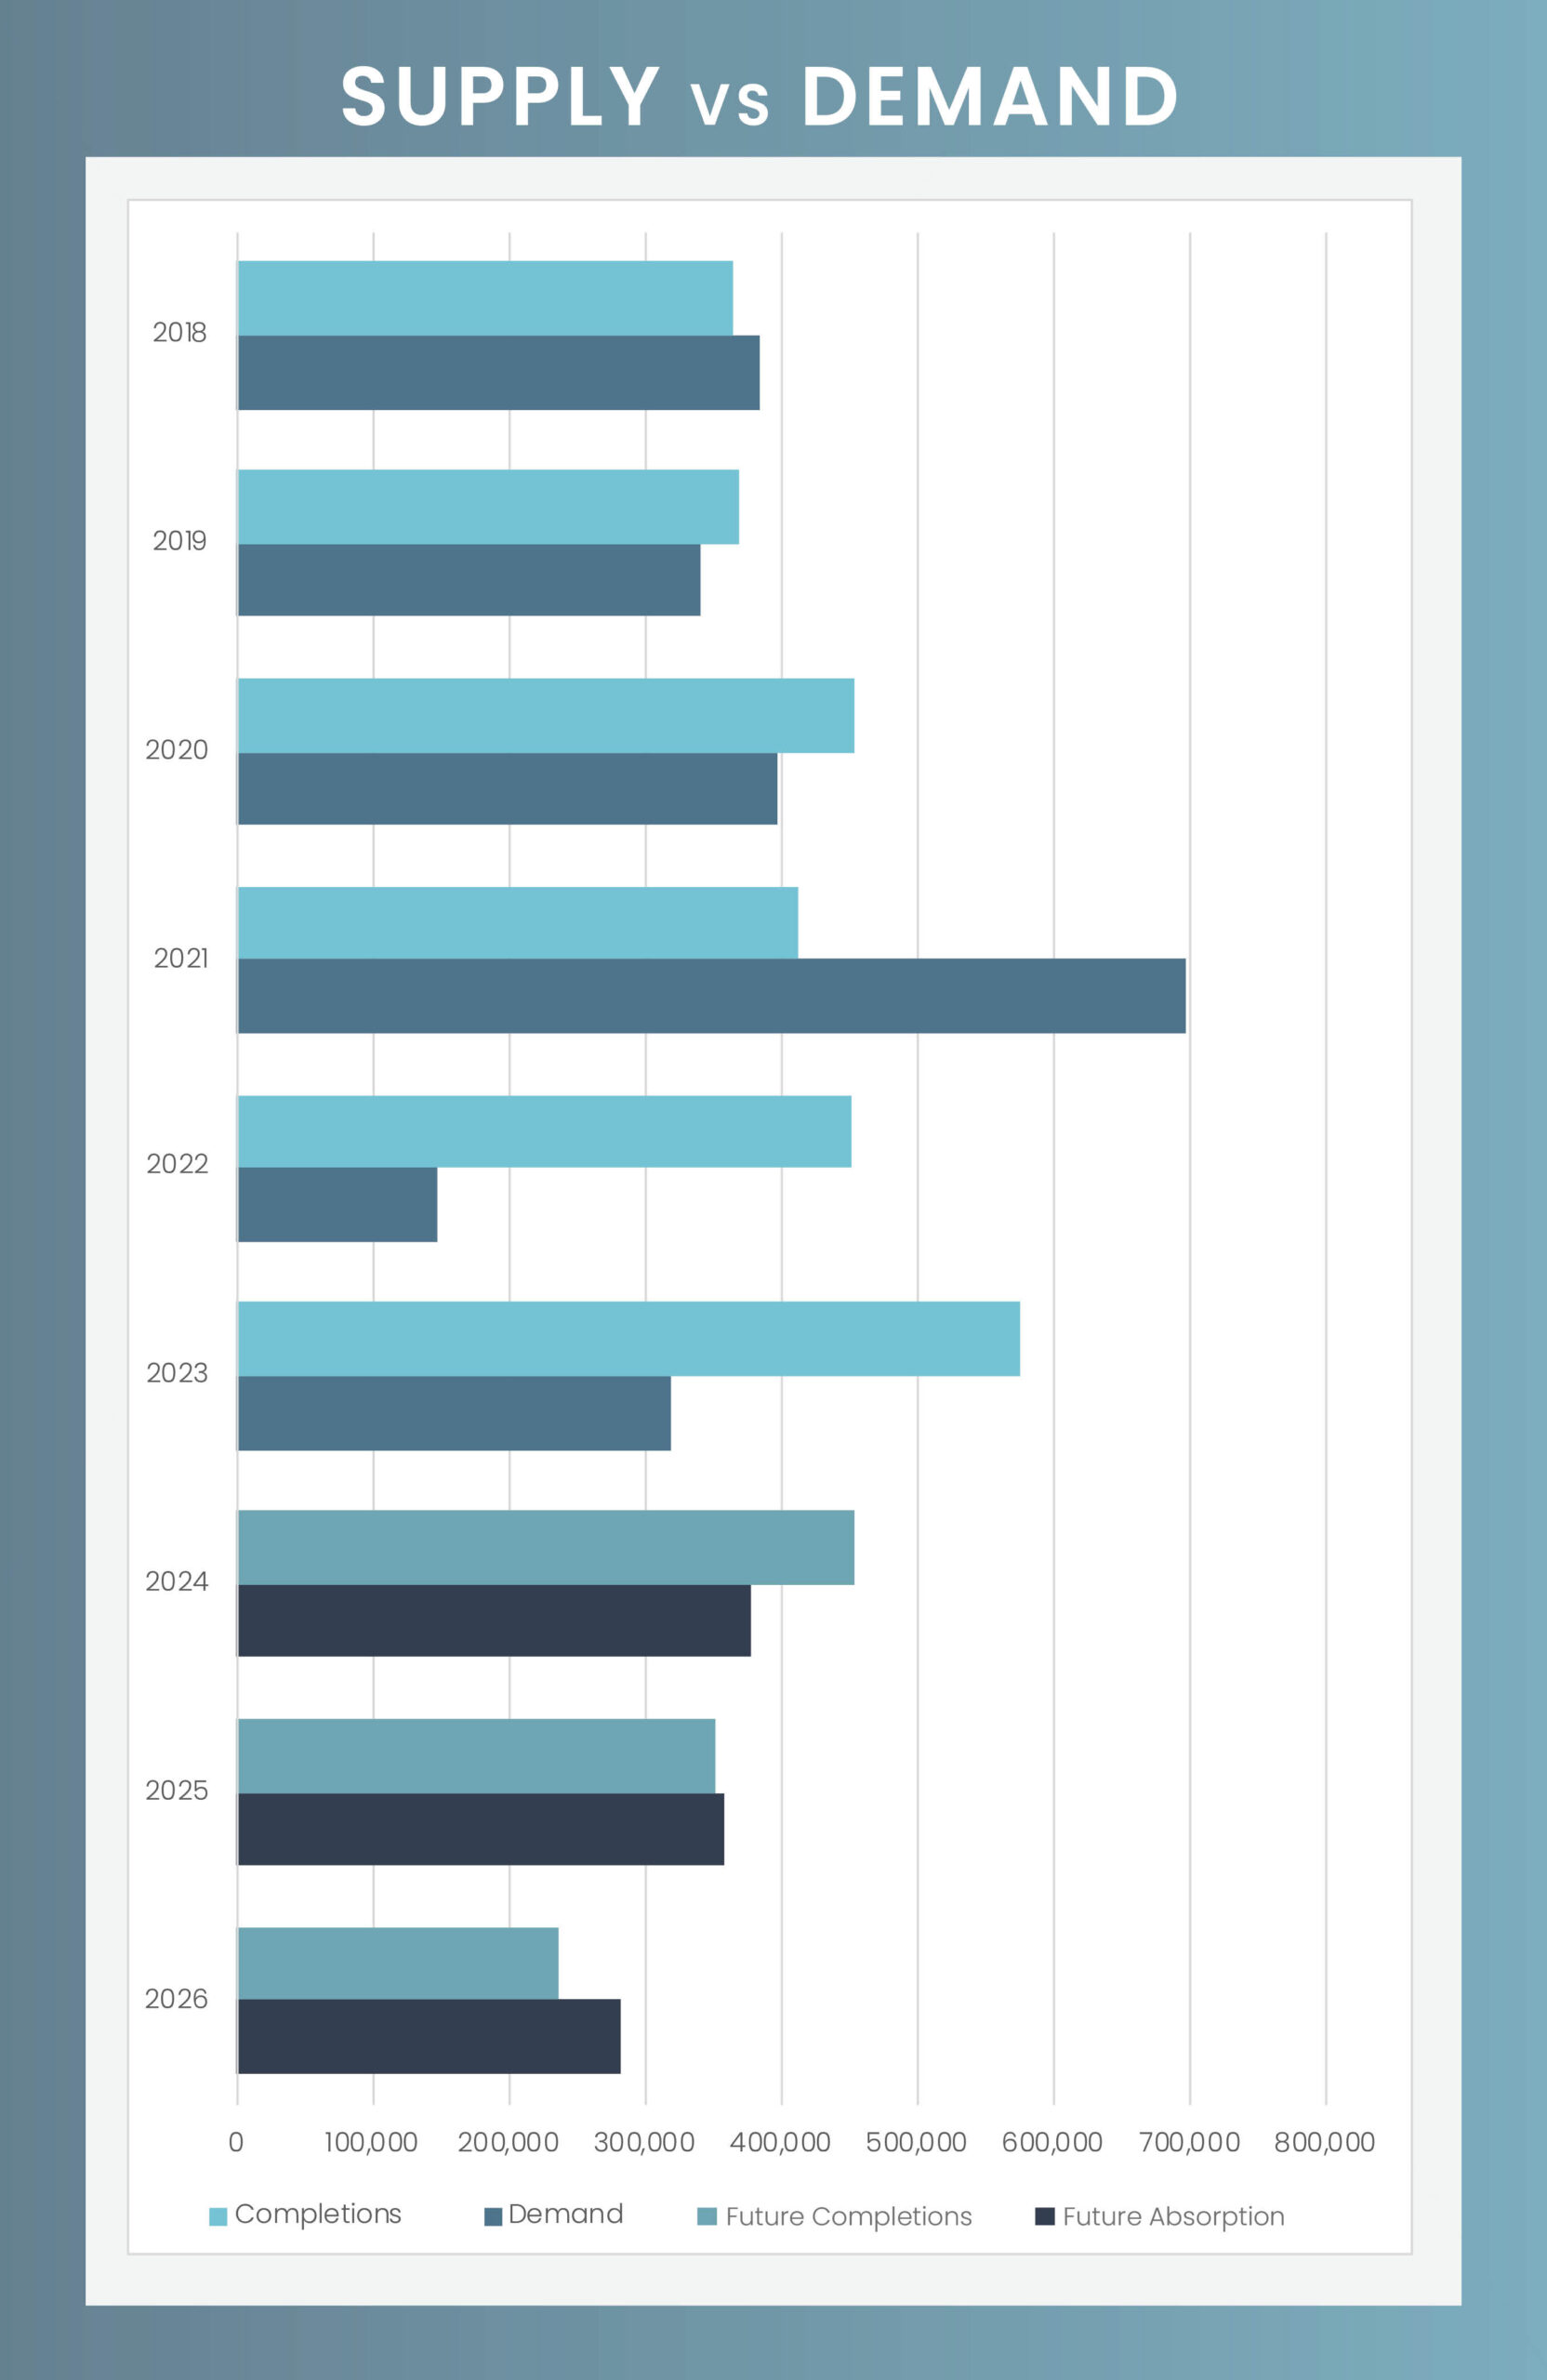
Looking ahead to 2024, the national outlook for rent growth is cautiously optimistic, with expectations for it to remain under 1% during the traditionally slower winter leasing period. Nonetheless, a brighter outlook is forecasted, with a projected 25% decrease in new unit completions to approximately 453,000, down from a 40-year peak in 2023. Demand is also anticipated to continue its upward trajectory, bolstered by an 18% increase in net absorption to 375,000 units, contingent upon a stable economy that maintains renter confidence.

The Class B segment, which concluded 2023 with a 1.6% annual rent increase, outperforming the broader U.S. average, is particularly noteworthy. These properties have largely avoided the oversupply challenges plaguing the luxury market, positioning them for potential demand and performance increases. Conversely, the luxury segment may continue to face challenges in achieving positive rent growth due to ongoing supply concerns.

Examining market-specific dynamics more closely reveals a cautiously optimistic forecast for rent growth, with expectations set for all major markets to experience positive rent increases by the end of 2024. This marks a significant turnaround from the 19 markets with at least 50,000 units that experienced negative annual rent growth in the fourth quarter of 2023, notably led by Austin with a -5.2% annual change. While a shift towards expansion is predicted for all major markets by the fourth quarter of 2024, Sun Belt markets, currently burdened by excess supply, may experience slower growth rates compared to their historical norms, indicating a prolonged recovery period in these markets.

It is important to note that these are year-end projections, and markets that were significantly impacted in 2023, such as Austin, Texas, may not see positive year-over-year rent growth until later in 2024. As 2024 unfolds, the narrative is shaping up to be one of rebound and recovery, with the potential for market dynamics to shift from stabilization to recovery as early as the second half of the year. However, the pace of this transition is expected to vary across regions, with the Midwest and Northeast potentially leading in rent growth expansion, while Sun Belt markets may face additional challenges before witnessing a positive growth trajectory.

Occupancy & Rent Trends

Top 50 Markets Rent & Occupancy

Top 50 MarketsQ4 2023 Stabilized OccupancyQ4 2024 Stabilized Occupancy (f)Annual Occupancy Change (2024/2023)Q4 2023 Average Monthly RentQ4 2024 Average Monthly Rent (f)Annual Rent Change (2024/2023)
San Jose95.5%95.9%0.3%$2,875$3,0245.2%
San Francisco94.3%94.4%0.1%$2,963$3,1094.9%
Oklahoma City89.6%89.6%0.0%$953$9924.1%
Norfolk94.1%94.1%0.0%$1,439$1,4964.0%
Louisville94.7%94.4%-0.2%$1,127$1,1713.8%
Cleveland92.7%92.6%0.0%$1,132$1,1733.6%
Miami96.2%96.1%-0.1%$2,288$2,3703.6%
East Bay93.7%93.7%0.0%$2,338$2,4163.3%
Baltimore93.8%93.8%0.0%$1,604$1,6573.3%
Washington94.6%94.3%-0.3%$2,100$2,1673.2%
Northern New Jersey96.8%96.5%-0.3%$2,054$2,1203.2%
Detroit92.8%92.5%-0.3%$1,223$1,2623.2%
Tucson92.2%91.8%-0.4%$1,124$1,1593.1%
Orange County96.9%96.8%-0.1%$2,632$2,7113.0%
Seattle94.3%94.0%-0.3%$1,942$1,9972.9%
Chicago95.1%94.9%-0.3%$1,688$1,7352.8%
Sacramento94.1%93.8%-0.3%$1,760$1,8092.8%
Inland Empire94.5%94.1%-0.4%$1,964$2,0182.7%
Las Vegas91.4%91.2%-0.3%$1,406$1,4432.6%
Fort Lauderdale94.5%94.3%-0.3%$2,217$2,2762.6%
Pittsburgh94.6%94.2%-0.3%$1,276$1,3092.6%
Cincinnati94.4%94.0%-0.4%$1,205$1,2352.5%
Boston96.1%95.8%-0.3%$2,730$2,7982.5%
Memphis86.4%86.2%-0.2%$1,096$1,1222.4%
Milwaukee96.3%96.0%-0.3%$1,333$1,3652.4%
Kansas City93.2%92.9%-0.3%$1,234$1,2632.3%
Columbus93.9%93.5%-0.3%$1,238$1,2662.3%
New York97.9%97.9%0.0%$3,062$3,1302.2%
Nashville92.7%92.5%-0.2%$1,595$1,6302.2%
Los Angeles95.5%95.5%0.0%$2,209$2,2582.2%
Saint Louis91.2%90.8%-0.3%$1,176$1,2012.2%
Tampa93.4%93.1%-0.3%$1,731$1,7672.1%
Indianapolis92.0%91.7%-0.3%$1,213$1,2382.1%
Portland94.3%94.0%-0.3%$1,573$1,6052.0%
Richmond93.0%92.7%-0.3%$1,426$1,4552.0%
Denver94.1%93.8%-0.3%$1,794$1,8261.8%
Philadelphia94.9%94.6%-0.3%$1,680$1,7091.8%
San Diego95.9%95.4%-0.5%$2,379$2,4201.7%
Minneapolis94.6%94.2%-0.3%$1,442$1,4661.7%
Phoenix91.9%91.6%-0.3%$1,529$1,5521.5%
Salt Lake City93.4%93.1%-0.3%$1,540$1,5601.3%
Jacksonville90.9%90.6%-0.3%$1,438$1,4561.2%
San Antonio90.2%89.7%-0.4%$1,226$1,2411.2%
Orlando93.2%92.8%-0.4%$1,726$1,7441.1%
Houston90.9%90.6%-0.3%$1,301$1,3141.0%
Dallas-Fort Worth91.8%91.4%-0.4%$1,493$1,5050.8%
Raleigh92.6%92.3%-0.3%$1,488$1,4990.8%
Austin91.3%90.8%-0.5%$1,561$1,5710.6%
Atlanta90.7%90.3%-0.4%$1,577$1,5820.3%
Charlotte92.5%92.2%-0.3%$1,532$1,5360.2%

Top 50 Markets Construction Pipeline

13,855,007

4Q 2023 Unit Inventory

734,527

Number of Units Under Construction

Top 50 MarketsUnit Inventory: 4Q 2023Units Under Construction% of Existing Inventory UC
Tucson83,5112,0562%
Louisville89,7374,8695%
Salt Lake City91,4378,5359%
Oklahoma City97,2363,4294%
Memphis99,2843,1243%
Pittsburgh104,1781,9742%
Richmond104,2174,9255%
Milwaukee113,3613,6823%
Jacksonville114,67010,4779%
Norfolk122,4563,0022%
Raleigh124,47013,82011%
Cleveland134,3563,6073%
Fort Lauderdale136,27910,1807%
Cincinnati139,6284,4103%
Sacramento140,5213,4552%
Saint Louis146,1173,0072%
San Jose156,8267,9085%
Nashville162,68219,66012%
Northern New Jersey164,00313,8668%
Indianapolis166,9756,9134%
Inland Empire173,0245,3593%
Kansas City174,2837,7474%
San Francisco179,8824,1902%
Las Vegas185,6656,8814%
Miami187,12127,45815%
East Bay189,7154,3092%
Baltimore209,3005,0662%
Orlando211,77020,62610%
Columbus212,4368,6564%
San Antonio213,84018,0818%
Charlotte216,20031,24314%
Tampa219,58917,2758%
Portland226,1688,3124%
Detroit229,5874,7582%
Orange County250,3926,8683%
Boston271,63412,7015%
Minneapolis273,45612,6995%
San Diego277,2267,6583%
Austin286,30941,86315%
Denver293,65227,8529%
Philadelphia357,48018,9015%
Phoenix380,73735,6499%
Seattle381,92424,0996%
Atlanta504,80730,8436%
Chicago556,37110,9952%
Washington565,11329,7505%
Houston700,60125,1404%
Dallas-Fort Worth852,96555,4887%
Los Angeles1,035,47823,6512%
New York1,546,33867,5104%

Sales Activity

The apartment market once again emerged as the premier class for commercial real estate investments. Despite a significant 61% reduction in transaction volume compared to the previous year, the sector maintained its dominance. This downturn, along with a dip in property values within the apartment sector, may raise concerns among investors. However, a closer look at the data sets reveals a more balanced observation of the current market.

Reflecting on the past two years, the apartment sector experienced an unprecedented surge in transaction activity, with an annual average investment of $332 billion in 2021 and 2022. This figure starkly surpasses the sector’s former peak in 2019, which saw $195 billion in transactions. The activity in 2021 and 2022 exceeded the previous record by 70%, driven by the historically low interest rates and money printing that occurred in the early days of the pandemic Covid-19 pandemic to combat a major economic depression.

Prior to the challenges imposed by the global health crisis, the apartment sector was already drawing significant interest from investors, driven by the dual pressures of potential interest rate hikes and the appeal of investments that necessitate limited capital outlays. This trend, when combined with the search for assets capable of delivering consistent returns amidst the uncertainties brought about by the pandemic, set the stage for a notable surge in investor enthusiasm. The years 2021 and 2022, marked by unprecedentedly low borrowing costs, further amplified this interest, propelling investment activities to unprecedented levels.

Despite the shift in financing conditions in 2023, with the lower cost of financing no longer in play, the apartment sector continues to hold attractive elements for investors, although it may not reach the peak levels of recent years. The observed decrease in transaction volumes might initially appear concerning, reminiscent of the steep declines witnessed during the 2008 and 2009 Global Financial Crisis. However, it is crucial to interpret this decline within its proper context; a 60% reduction from historical norms to the depths of the financial crisis carries a different connotation compared to a retraction from peak levels to transaction volumes that are more in line with those seen in the mid-2010s.

Dallas and Atlanta stood out as the top performers on an individual market basis, despite facing declines in transaction volumes of 59% and 64% respectively, on a year-over-year basis. Following closely were Los Angeles, Chicago, and the New York Boroughs, completing the top 5. Chicago, in particular, made a significant leap from 11th place in 2022 to 4th in 2023, with a relatively modest transaction volume decrease of 37% compared to other markets. Conversely, Orlando and Charlotte witnessed substantial downturns, sliding to the 16th and 17th spots, respectively. The decline in these markets was pronounced, with transaction volumes plummeting by more than 70% year-over-year.

TRANSACTION VOLUME


2023 Transaction Volume

Y-O-Y Change

YTD Individual Transaction Count

Price Per Unit

Annual PPU Price Change

* Trailing 4Q average PPU

* Preliminary Data from RCA – Individual transaction $2.5M +

P=Preliminary

Economic Forecast

EMPLOYMENT *

156.14M 2023

158.17M 2024

UNEMPLOYMENT RATE**

3.6% 2023

4.1% 2024

* Please note that these employment figures have been adjusted for seasonal variations and are based on Moody’s Analytics forecast as of January 1, 2024.

** Please note that these unemployment rates are estimates that have not been adjusted for seasonal variations, and they are derived from Moody’s Analytics forecast as of January 1, 2024.

According to projections by Goldman Sachs Research, the US economy is set to continue its healthy expansion, albeit at a marginally reduced pace, with an anticipated growth of 2.1% in the US GDP for the full year. Goldman Sachs Research highlights a notably low 15% chance of a recession in the US over the next year, suggesting that fears of an economic slump may be exaggerated.

The primary engine for economic growth in 2024 is expected to be strong consumer spending, underpinned by a 3% increase in real disposable income. This is expected to be driven by consistent employment growth, approximately 1% real growth in wages, and inflation rates aligning with the Federal Reserve’s objectives. On the other hand, a slowdown is projected in business investment, following a surge last year propelled by incentives from legislative measures like the CHIPS Act and the Inflation Reduction Act. Nonetheless, heightened investments in artificial intelligence and a decrease in concerns about a recession could enhance the confidence of business leaders, leading to a rise in business investment for 2024. Regarding fiscal policy, federal government expenditure is anticipated to stay steady, complemented by a modest 0.5% uptick in spending by state and local governments.

Labor market conditions are expected to remain resilient, shifting towards a more moderate job growth rate of about 100,000 jobs per month in the second half of 2024. The unemployment rate is forecasted to hover in the high 3% to low 4% range, supported by a low rate of layoffs and job vacancies maintaining levels above those recorded in 2019, which was one of the strongest labor markets in US history.

To Gain Further InsightS Please Reach Out To Our National Team

Alex Blagojevich

Executive Managing Director & Founding Partner

Michael Sullivan

Executive Managing Director & Founding Partner

Nate Ulepich

National Director of Sales

Brett Meinzer

Managing Director

David Huey

Senior Director

Kendall Adams

Senior Advisor

Ryan Carter

Associate Advisor

William Costello

Associate Advisor

Thomas Skevington

Senior Advisor

Kyle Winston

Senior Advisor

Chris Wilson

Associate Advisor