Nashville 2024 Market Forecast

MARKET SNAPSHOT

AVERAGE RENT

$1,594  4Q 2023

$1,624 4Q 2024

2024 RENT CHANGE

1.9%

OCCUPANCY RATE

92.6% 4Q 2023

92.3% 4Q 2024

4Q 2024 OCCUPANCY CHANGE

-30 POINTS

EMPLOYMENT*

1.16M 2023

1.17M 2024

UNEMPLOYMENT RATE**

2.6% 2023

3.0% 2024

* Please note that these employment figures have been adjusted for seasonal variations and are based on Moody’s Analytics forecast as of January 1, 2024.

** Please note that these unemployment rates are estimates that have not been adjusted for seasonal variations, and they are derived from Moody’s Analytics forecast as of January 1, 2024.

KEY TAKEAWAYS

  • Nashville stands out nationally with 11.8% of its inventory under development, outpacing the national average but recording a decrease in construction starts in 2023 due to rising capital costs.

  • Despite the forecasted 30 basis point decrease in occupancy for 2024, the slowing pace of this decline indicates a movement towards greater market stability and recovery in Nashville.

  • Despite the influx of new units tempering rent growth, Nashville’s multifamily market anticipates a positive rent trajectory in 2024, with all submarkets, including Downtown Nashville, projected to see growth, albeit at varying rates.

  • Nashville ended 2023 with strong sales activity in multifamily assets, with sales volume reaching $553.6 million, marking a 35% increase over the same period in 2022.

Supply & Demand

2024 FULL YEAR FORECAST

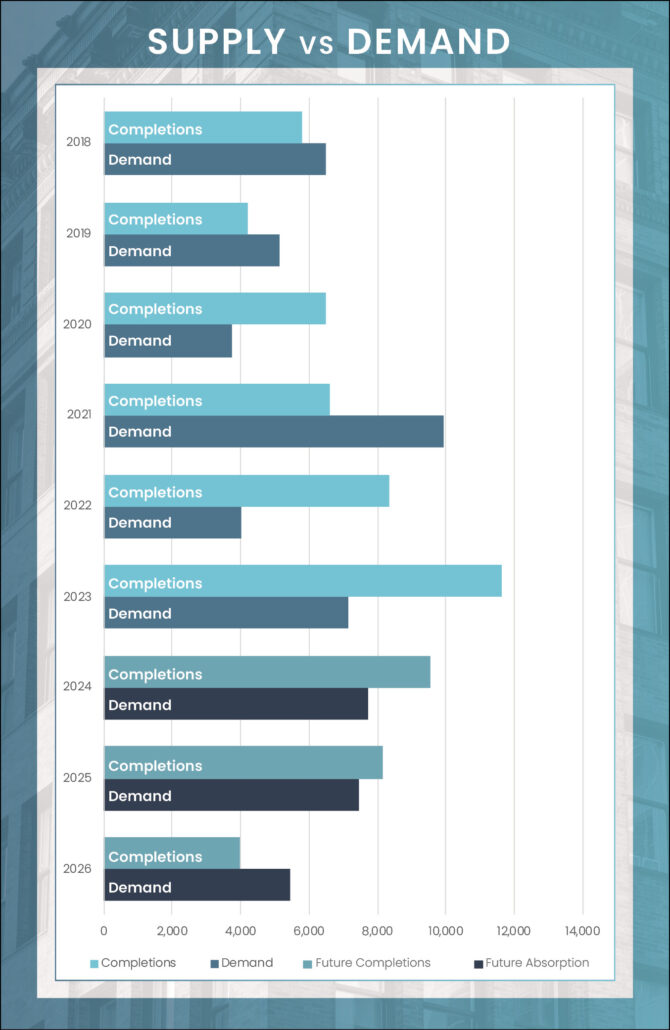
7,717 Units

FORECASTED ABSORPTION

9,530 Units

FORECASTED NEW SUPPLY

Annual Demand vs Completions

Demand / Occupancy Outlook

Nashville’s multifamily market is on the path to stabilization despite the challenges posed by a surge in new supply. In 2023, over 11,600 new units were introduced, a volume that has been challenging to match even with a significant 78% increase in demand year over year. This influx of new units has led to decreasing occupancy, with the average rate standing at 92.6% as of the final quarter of 2023, a notable drop from the 95.6% average just two years prior.

Looking ahead to 2024, robust demand driven by strong net migration and economic growth is expected, yet it may not be sufficient to balance out the 9,500 units scheduled for completion. Consequently, the average occupancy rate in Nashville is projected to decline slightly to 92.3%, marking a 30-basis point decrease from the end of 2023. However, the silver lining is that the rate of occupancy decline is slowing, suggesting the market is moving towards greater stability and recovery.

New Supply Outlook

When considering markets with rapidly expanding apartment inventories in recent years, Nashville consistently emerges as one of the top contenders. Currently, it holds the fourth position among the 50 largest U.S. markets in terms of the ratio of units under construction to existing inventory. With 11.8% of its inventory in development, Nashville greatly exceeds the national average of 5.0%, although it trails behind leading markets like Miami, Charlotte, and Austin, all of which have development rates surpassing 13% as of early 2024. In absolute terms, there are about 19,000 units under construction in the Nashville metro, but this number has been declining due to a reduction in new construction starts. The rising cost of borrowing capital, which has nearly doubled in the past year and a half, has led to fewer new projects. This resulted in only 4,500 units commencing in 2023, marking Nashville’s lowest annual start since 2012.

Downtown Nashville remains one of the country’s most active submarkets for development, continuing to draw significant attention. However, Southeast Nashville has also experienced substantial growth, with approximately 5,300 units introduced since 2020. This demonstrates that while Downtown Nashville often dominates the headlines for new supply, other areas like Southeast Nashville are also expanding rapidly.

Occupancy & Rent Trends

RENT VS OWN MONTHLY PAYMENT

$2,942

Average Monthly Mortgage Payment

$1,594

Average Monthly Rent

2024 Rent trends outlook

The anticipated arrival of new units in Nashville in 2024 is likely to temper average rent growth market-wide for the second consecutive year. The influx will particularly impact Class A properties, where the majority of these new units will be delivered, intensifying competition among property operators and potentially leading to only modest rent increases. Downtown Nashville stands out as especially susceptible to further rent stagnation, with about 8,800 units under construction – nearly 35% of the current 25,317 operational units in the submarket, exerting significant downward pressure on rent growth.

However, it’s crucial to recognize that widespread rent declines are not expected in Nashville for 2024. Out of the city’s 16 submarkets, all are projected to see positive rent growth by the fourth quarter of 2024. This suggests a generally optimistic outlook for the majority of Nashville’s market. Despite certain challenges, like those in Downtown Nashville where rent growth is anticipated to lag behind at 1.5%, the greater Nashville market is forecasted to see rent growth inch back to nearly 2.0%, demonstrating resilience in the face of substantial supply increases.

Submarket Rent & Occupancy

SubmarketQ4 2023 Stabilized OccupancyQ4 2024 Stabilized Occupancy (f)Annual Occupancy Change (2024/2023)Q4 2023 Average Monthly RentQ4 2024 Average Monthly Rent (f)Annual Rent Change (2024/2023)
Bellevue92.8%92.5%-0.3%$1,601$1,6392.4%
Donelson/Hermitage91.9%91.6%-0.4%$1,423$1,4542.1%
Downtown Nashville92.0%91.7%-0.3%$2,039$2,0691.5%
Madison/Rivergate91.6%91.8%0.2%$1,441$1,4641.6%
Maury County94.8%94.6%-0.3%$1,518$1,5461.9%
Murfreesboro92.8%92.4%-0.3%$1,428$1,4541.9%
Outlying Northeast96.3%96.0%-0.3%$652$6712.9%
Outlying West95.8%95.5%-0.3%$1,338$1,3692.3%
Robertson County97.0%96.9%-0.1%$1,551$1,5761.6%
Smyrna/La Vergne95.7%95.5%-0.2%$1,495$1,5302.3%
Southeast Nashville92.4%92.0%-0.3%$1,382$1,4122.2%
Sumner County94.1%93.8%-0.3%$1,478$1,5041.7%
West End Nashville92.5%92.1%-0.3%$1,873$1,9071.8%
West Nashville92.9%92.6%-0.3%$1,619$1,6451.6%
Williamson County92.7%93.0%0.3%$1,838$1,8691.7%
Wilson County90.5%90.1%-0.4%$1,590$1,6151.6%
Market92.6%92.3%-0.3%$1,594$1,6241.9%

Submarket Construction Pipeline

162,185

4Q 2023 Unit Inventory

19,075

Number of Units Under Construction

9,530

Number of Units UC Delivering
In the Next 4 Quarters

SubmarketUnit Inventory: 4Q 2023Units Under Construction% of Existing Inventory UC% of Total UCUnits UC Delivering In the Next 4 Quarters
Bellevue6,77500.0%0.0%0
Donelson/Hermitage10,3988057.7%4.2%805
Downtown Nashville25,3178,81634.8%46.2%1,811
Madison/Rivergate10,5641,95718.5%10.3%1,091
Maury County5,4912945.4%1.5%294
Murfreesboro18,5203201.7%1.7%0
Outlying Northeast35800.0%0.0%0
Outlying West1,40000.0%0.0%0
Robertson County71744862.5%2.3%448
Smyrna/La Vergne4,9624318.7%2.3%431
Southeast Nashville34,1305941.7%3.1%498
Sumner County10,0978758.7%4.6%825
West End Nashville6,9271,05215.2%5.5%750
West Nashville6,27094215.0%4.9%942
Williamson County12,2578136.6%4.3%458
Wilson County8,0021,72821.6%9.1%1,177
Market162,18519,07511.8%100.0%9,530

Sales Activity

Sales volume for conventional multifamily assets in Nashville ended 2023 on a high note, according to preliminary data from MSCI. The final quarter’s sales volume reached $553.6 million, marking a significant 35% increase over the same period in 2022 and recording the second-highest fourth-quarter total in the last decade. Despite this strong quarter, annual transaction volume for 2023 didn’t quite reach 2022’s levels, totaling $1.33 billion across 34 individual asset sales, a 49% decrease from the previous year but still surpassing the pre-pandemic annual average.

As we look towards 2024, with a clearer picture of interest rates, Nashville’s continued prominence as a leading multifamily investment market offers promising opportunities for discerning investors. The potential for more attractively priced deals is expected to attract investment, leveraging the market’s ongoing growth and appeal in the multifamily sector.

  1. Weinstein Properties
  2. Covenant Capital Group
  3. Hamilton Zanze & Co
  4. OpenPath Investments
  1. BREIT
  2. Wood Partners
  3. Alliance Residential
  4. Graycliff Capital

*Most Active Buyers and Sellers are based on the sale volume of apartment units.

TRANSACTION VOLUME


2023 Transaction Volume

Y-O-Y Change

Individual Transaction Count

Price Per Unit

Annual PPU Price Change

* Trailing 4Q average PPU

* Preliminary Data from RCA – Individual transaction $2.5M +

P=Preliminary

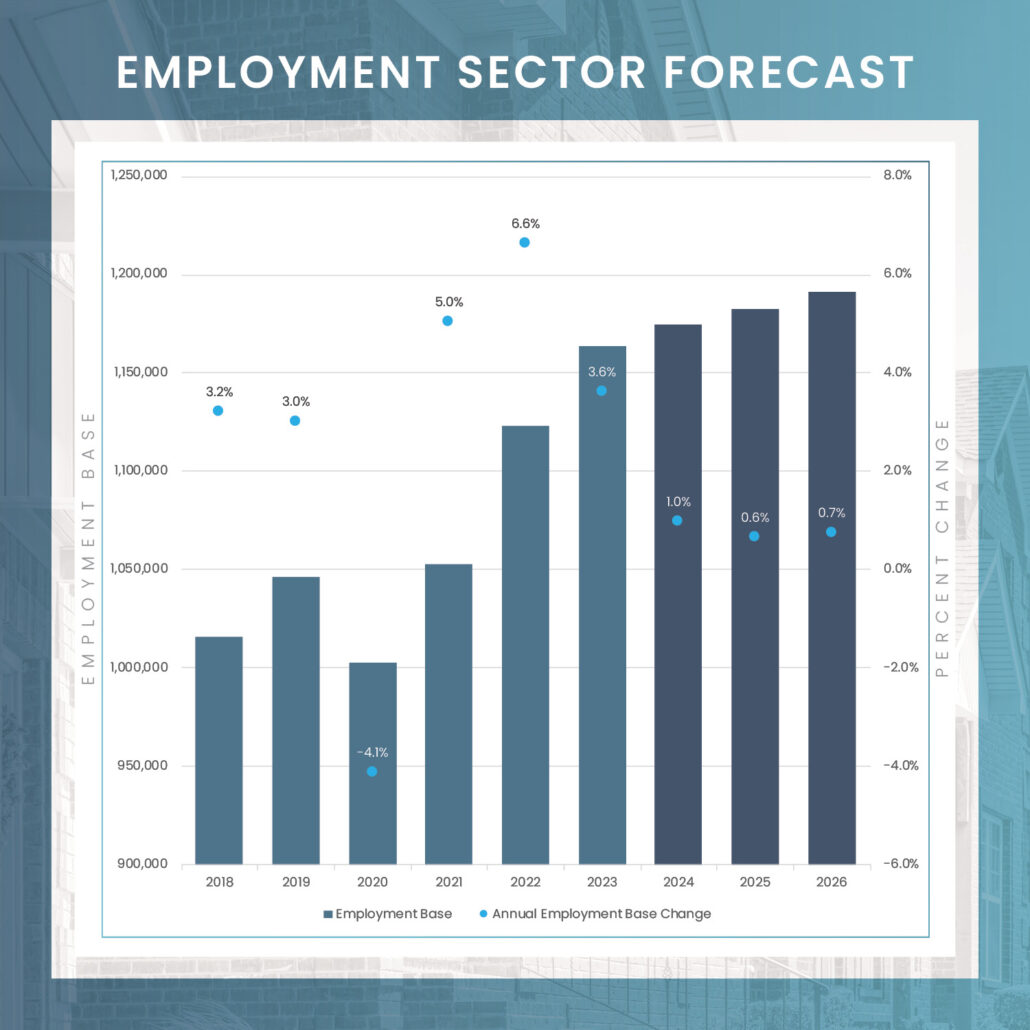
Employment Forecast

Forecasted 2024 Employment Sector Growth

SectorEmployment Change 2023 to 2024 Percent Change
Overall Employment11,200 1.0%
Manufacturing1,800 1.9%
Construction(600)-1.1%
Trade, Transport., & Utilities2,100 0.9%
Information100 0.3%
Financial Activities800 1.2%
Professional & Business Services3,400 1.7%
Education & Health Services3,000 1.8%
Government700 0.6%
Leisure & Hospitality900 0.7%
Other Services600 1.0%

Economic Outlook

Predicting a slowdown in Nashville’s economy for 2024 might be hasty. The region continues to be a strong magnet for new residents and professionals, with job growth since 2020 significantly surpassing the national average. The healthcare sector is a major contributor, with 500 companies, including 17 public entities. Nashville has also become a hub for tech expansion beyond Silicon Valley, attracting corporate headquarters and substantial investments from tech giants like Oracle, Amazon, and Meta Platforms.

For 2024, the overall employment in Nashville is expected to grow by 11,200 jobs, with the education and health services sector and the professional and business services sector projected to add 3,000 and 3,800 jobs, respectively. These indicators collectively point to a continued robust growth trajectory for Nashville in the upcoming year, maintaining its status as a dynamic and expanding economic center.

Sources: Costar; Yardi Matrix; BLS; MSCI; Moody’s Analytics

To Gain Further Insights Into The Nashville Market Please Reach Out To Our National Team

Alex Blagojevich

Executive Managing Director & Founding Partner

Michael Sullivan

Executive Managing Director & Founding Partner

Nate Ulepich

National Director of Sales

Brett Meinzer

Managing Director

David Huey

Senior Director

Kendall Adams

Senior Advisor

Ryan Carter

Associate Advisor

Thomas Skevington

Senior Advisor

Kyle Winston

Senior Advisor

Chris Wilson

Associate Advisor