average rent
average occupancy rate
ytd sales volume
YoY rent change
yoy occupancy change
individual transactions
QUARTERLY DEMAND
YTD: -76
QUARTERLY COMPLETIONS
YTD: 643


Average Monthly Mortgage Payment
Average Monthly Rent
* The Average mortgage payment is based off a median home sales price of $362,100 as reported by NAR.
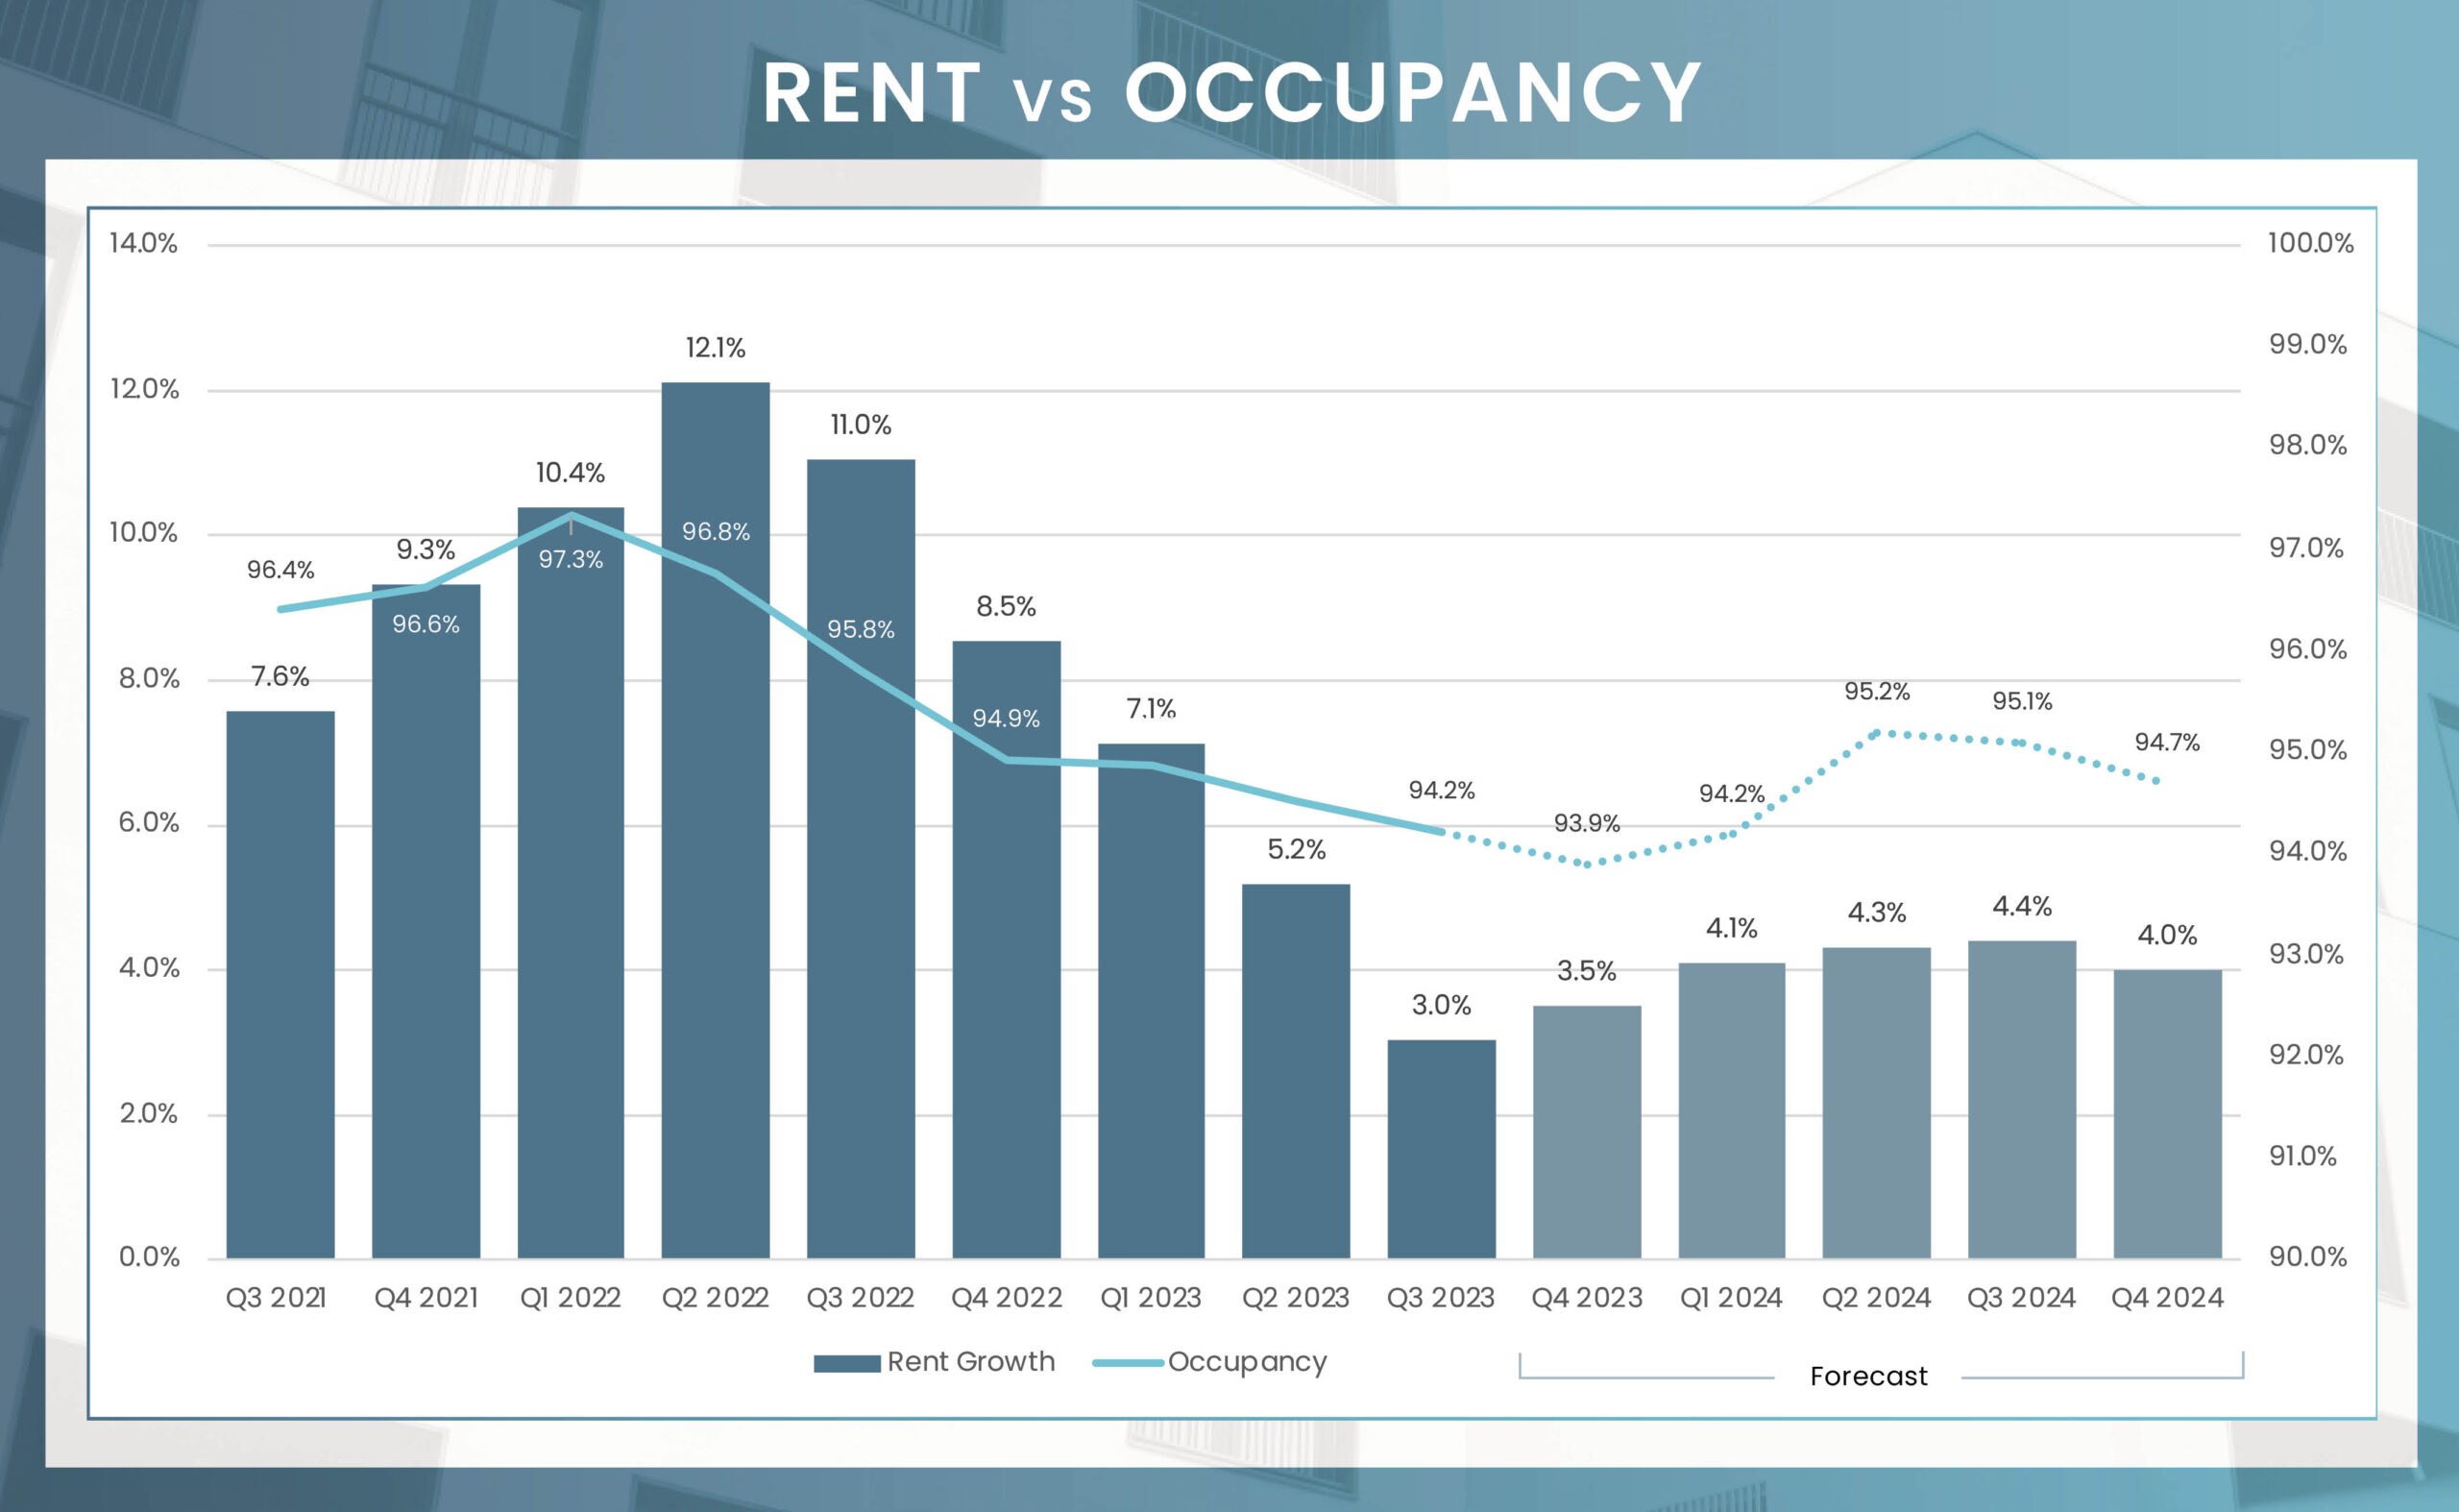
Over the past year, the occupancy rate in the Louisville apartment market declined by 1.6 percentage points, settling at 94.2% for Q3 2023. A breakdown by product class for the same quarter reveals occupancy rates of 93.9% for Class A units, 93.7% for Class B units, and a notably high 95.4% for Class C units, which have generally been the tightest in terms of occupancy over the past five years. On a submarket level, Q3 2023 occupancy was highest in South Central Louisville (95.2%) and Northwest Louisville (94.9%), while the lowest rates were recorded in Southeast Louisville (93.1%) and Southwest Louisville (93.8%). Moving forward, occupancy levels in Louisville are projected to stabilize around 95% in the coming year.
In Q3 2023, the Louisville apartment market saw a 3.0% year-over-year increase in new lease rents, surpassing the pre-pandemic average annual growth of 2.6%. When examined by product class, annual effective rent change for the quarter registered at 2.8% for Class A units, 2.4% for Class B units, and a notable 4.5% for Class C units. Among submarkets, South Central Louisville led with a 5.8% annual rent change, closely followed by Southwest Louisville at 5.1%, while the weakest performances were in Northeast Louisville (0.8%) and Northwest Louisville (1.1%). With demand projected to revert to historical performance levels over the next four quarters, rent growth is expected to accelerate, falling within the higher bounds of 3.0% and the lower bounds of 4.0% for the upcoming year.
| Submarket | Average Occupancy | Annual Occupancy Change | Average Monthly Rent | Annual Rent Change |
|---|---|---|---|---|
| Central Louisville | 93.9% | -0.6% | $1,279 | 3.3% |
| Northeast Louisville | 94.3% | -1.6% | $1,361 | 0.8% |
| Southeast Louisville | 93.1% | -3.1% | $1,212 | 4.9% |
| South Central Louisville | 95.2% | -0.7% | $1,087 | 5.8% |
| Southwest Louisville | 93.8% | -1.5% | $1,057 | 5.1% |
| Northwest Louisville | 94.9% | -1.8% | $1,037 | 1.1% |
| Louisville/Jefferson County, KY-IN | 94.2% | -1.6% | $1,196 | 3.0% |
Number of Units Under Construction
Number of Units Units UC Delivering In the Next 4 Quarters
Transaction dollar volume for single asset conventional multifamily trades in Louisville totaled roughly $135.7 million through the 3rd quarter 2023, down about 80% year-over-year. Meanwhile, the number of transactions decreased about 82% compared to the same timeframe last year, with only 5 apartment properties trading hands so far in 2023. Meanwhile, the average price per unit in Las Vegas came in at roughly $130,900, down 15% annually.
*Most Active Buyers and Sellers are based on the sale volume of apartment units.
* Trailing 4Q average PPU
* Preliminary Data from RCA – Individual transaction $2.5M +
As of August 2023, Louisville’s employment landscape showcased varied growth across multiple sectors. The manufacturing sector led the way with a robust 7.3% increase, adding 6,100 jobs, closely followed by the mining, logging, and construction sector, which grew by 6.0%. Leisure and hospitality also saw a noteworthy uptick of 3.0%. On the downside, financial activities and professional and business services contracted, losing 2,800 and 3,500 jobs, respectively. Overall, the city generated 9,400 new jobs, resulting in an employment growth rate of 1.4%. The unemployment rate stood at 3.8%, in line with the national average, underscoring a balanced job market.
August Annual Jobs Created
August 2023 Employment growth
August 2023 Unemployment rate
3.8% us rate
Change from August 2022 to August 2023:
1,800
Percent Change:
1.1%
Change from August 2022 to August 2023:
6,100
Percent Change:
7.3%
Change from August 2022 to August 2023:
2,100
Percent Change:
3.0%
Change from August 2022 to August 2023:
700
Percent Change:
1.0%
Change from August 2022 to August 2023:
1,900
Percent Change:
6.0%
| Sector | Change from August 2022 to August 2023 | Percent Change |
|---|---|---|
| Trade, transportation, and utilities | 1,800 | 1.1% |
| Manufacturing | 6,100 | 7.3% |
| Leisure and hospitality | 2,100 | 3.0% |
| Government | 700 | 1.0% |
| Mining, logging, and construction | 1,900 | 6.0% |
| Education and health services | 2,000 | 2.0% |
| Other services | 1,000 | 3.9% |
| Information | 100 | 1.1% |
| Financial activities | (2,800) | -5.8% |
| Professional and business services | (3,500) | -3.8% |
When comparing the cost of living between Louisville, KY, and Nashville, TN, several distinctions become apparent. According to the Cost-of-Living Index, Louisville boasts a more affordable score of 94.8 compared to Nashville. Specifically, housing costs in Louisville are significantly lower, at 27.0% less than those in Nashville, making it an attractive option for homebuyers and renters alike. However, Louisville falls behind in utilities and transportation, costing 10.5% and 9.5% more, respectively. Additionally, healthcare is 12.8% less expensive in Louisville. These data points indicate that Louisville offers a relatively cost-effective living environment, albeit with higher utility and transportation expenses.
94.8
$2,084
89.7
104.2
106.5
$270,900
The “Cost of Living” index score provides a comparative assessment of the relative expense involved in maintaining a standard of living in a specific area, benchmarked against a national index score of 100.
Looking ahead, the Louisville apartment market is poised for moderate expansion. With net absorption expected to return to historical levels over the next four quarters, the focus will be on Southwest and Southeast Louisville submarkets, which are projected to see the most significant demand. Meanwhile, new supply is forecasted to increase by 1.8%, falling in line with the prior five-year average. Given these dynamics, occupancy rates are anticipated to stabilize around 95%. Collectively, these factors suggest a balanced market environment where rent growth could oscillate between 3.0% and 4.0%, underlining the market’s resilience and appeal to both investors and renters.