Indianapolis 3Q23
Multifamily Market Report

$1,261

average rent

93.9%

average occupancy rate

$303.6M

ytd sales volume

3.2%

YoY rent change

-2.1 POINTS

yoy occupancy change

19

ytd individual transactions

Supply & Demand

3Q23

707 Units

QUARTERLY DEMAND
YTD: 806

1,341 Units

QUARTERLY COMPLETIONS
YTD: 3,027

Annual Demand vs Completions

2018
4,209
4,020
2019
3,095
3,760
2024
3,604
3,047
2021
4,171
5,077
2022
-1,755
1,563
2023 YTD
806
3,027
  • Planned
    Completions
  • Pre-Planned
    Demand

Demand Trends

  • In Q3 2023, the Indianapolis apartment market exhibited positive absorption, with renters newly occupying over 700 units. Although this figure is slightly below the typical seasonal average for the third quarter, it underscores the resilience of the local apartment market.


  • Among Indianapolis’ 13 submarkets, six recorded positive net absorption in Q3 2023. Notably, the Downtown Indianapolis submarket experienced an absorption of 519 net units.

Completion Trends

  • During Q3 2023, the apartment inventory in Indianapolis expanded by 1,341 units, with nearly 45% of the new units added in the Downtown Indianapolis submarket.


  • Historically, the suburbs of Indianapolis have attracted significant attention from developers. In particular, the Carmel submarket has stood out, accounting for 21.8% of the market’s new stock in the past year. This was closely followed by the Downtown Indianapolis submarket, which represented 27.5% of the recent completions.

Demand Outlook

  • Over the next four quarters, RealPage projects an absorption of 3,016 units, aligning with the pre-pandemic historical average for annual deliveries.


  • The Downtown Indianapolis and Carmel submarkets are projected to experience hotspots for rental demand in the coming year, with a combined annual net absorption forecasted at 873 units.

New Supply Outlook

  • Over the next four quarters, the apartment market in Indianapolis is slated to expand by an additional 5,436 units.


  • This new supply will be concentrated in the Carmel and Greenwood/Johnson County submarkets, which are expected to contribute significant additions of 3,253 units and 537 units, respectively.

Occupancy & Rent Trends

RENT VS OWN
MONTHLY PAYMENT

$2,407

Average Monthly Mortgage Payment

$1,261

Average Monthly Rent

* The Average mortgage payment is based off a median home sales price of $225,000 as reported by the Indiana Association of Realtors as of May 2023.

Occupancy trends

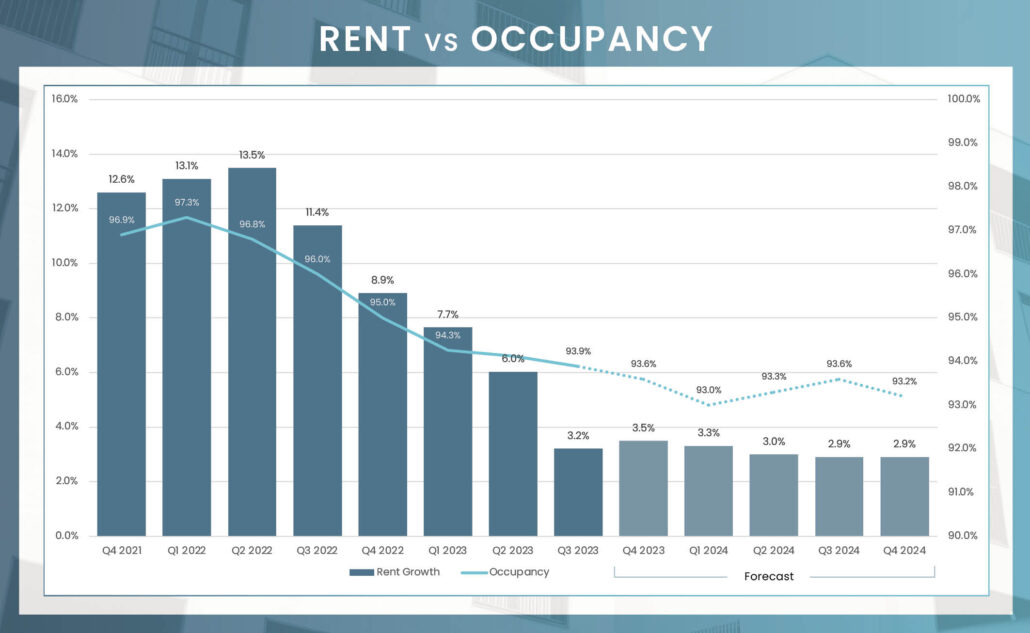
In Q3 2023, the resurgence of rental demand has been a welcomed development among apartment operators and investors in Indianapolis. This quarter marked the continuation of positive absorption, for the second consecutive quarter, following a year-long stretch of negative absorption. However, this upswing was insufficient to counterbalance the influx of new units added during the quarter, resulting in a modest 30 basis point quarterly decline in the average occupancy rate to 93.9%. Fluctuation among property classes was slight, with Class B properties at the higher end, registering a rate of 94.1%, while Class A and C units, at the lower spectrum, registered at 93.7%.

Similar to the preceding quarter, all thirteen Indianapolis submarkets reported annual reductions in occupancy, albeit with variations in degree. The Anderson submarket boasted a robust 96.5% occupancy, while three additional submarkets out of the thirteen registered occupancy rates surpassing 95.0%. On the flip side, Northeast Indianapolis, encompassing an inventory exceeding 16,500 units, witnessed a total of 605 net move-outs over the past year, causing it to register the lowest occupancy rate of the cohort at 92.0%.

RENTAL TRENDS

Reflecting nationwide trends observed in virtually all apartment markets, rent growth in Indianapolis is experiencing a deceleration from its peak gains noted in the prior year. However, Indianapolis remains an exception amid the broader slowdown. Despite the deceleration, it holds the seventh-highest rate for rent growth among the 50 largest apartment markets in the U.S., registering a 3.2% growth rate in the third quarter of 2023. This annual increase brings the average rental rate for new leases to $1,261. It’s imperative to highlight that while numerous markets are reverting to their long-term averages or even descending below them, Indianapolis continues to exceed its pre-pandemic historical average growth rate of 2.7%.

Concerning property classification, Class C properties witnessed the most pronounced annual increase, registering at 5.1%, followed by Class B at 3.0%, and Class A at 1.8%. Performance varied among submarkets, with Southwest Indianapolis and West Indianapolis leading the growth at a rate of 5.8%, while Greenwood/Johnson County lagged, recording a decrease of -1.4%.

Submarket Rent & Occupancy

SubmarketAverage OccupancyAnnual Occupancy ChangeAverage Monthly RentAnnual Rent Change
Anderson96.5%-0.1%$9453.6%
Carmel/Hamilton County94.9%-1.5%$1,5022.4%
Downtown Indianapolis93.3%-0.9%$1,5892.6%
Eagle Creek95.0%-1.5%$1,1747.7%
East Indianapolis93.3%-2.2%$1,0233.7%
Far West Indianapolis Suburbs95.1%-1.4%$1,3810.5%
Greenwood/Johnson County95.7%-0.7%$1,175-1.4%
Lawrence92.9%-2.2%$1,2441.4%
Northeast Indianapolis92.0%-3.8%$1,3191.6%
Northwest Indianapolis93.5%-2.9%$1,1504.2%
Southeast Indianapolis94.2%-1.1%$1,2272.1%
Southwest Indianapolis92.9%-2.9%$1,1055.8%
West Indianapolis92.7%-3.5%$1,0425.8%
Indianapolis93.9%-2.1%$1,2613.2%

Units by Submarket Delivering in 2023

9,213

Number of Units Under Construction

5,436

Number of Units UC Delivering In the Next 4 Quarters

Units Under Construction

Anderson - 0
0%
Carmel/Hamilton County - 5,672
0%
Downtown Indianapolis - 797
0%
Eagle Creek - 0
0%
East Indianapolis - 325
0%
Far West Indianapolis Suburbs - 384
0%
Greenwood/Johnson County - 638
0%
Lawrence - 205
0%
Northeast Indianapolis - 887
0%
Northwest Indianapolis - 0
0%
Southeast Indianapolis - 36
0%
Southwest Indianapolis - 269
0%
West Indianapolis - 0
0%

Units Delivering Next 4Q

Anderson - 0
0%
Carmel/Hamilton County - 3,253
0%
Downtown Indianapolis - 428
0%
Eagle Creek - 0
0%
East Indianapolis - 193
0%
Far West Indianapolis Suburbs - 91
0%
Greenwood/Johnson County - 537
0%
Lawrence - 205
0%
Northeast Indianapolis - 424
0%
Northwest Indianapolis - 0
0%
Southeast Indianapolis - 36
0%
Southwest Indianapolis - 269
0%
West Indianapolis - 0
0%

Sales Activity

While the notable decline in single-asset conventional multifamily transaction volume from the first three quarters of 2023 compared to the same time period in 2022 could draw concern, a deeper analysis of historical data offers a more balanced view. Examining transaction activity from the pre-COVID era of 2014 to 2019, the volume in the first three quarters ranged between $195.7 million in 2014 and $306.5 million in 2019, averaging $251.1 million over the six-year period. With a provisional volume of $303.6 million in the initial three quarters of 2023, it’s clear that despite the formidable challenges in the capital market, transactions continue to be effectively executed. This illustrates that the market, though impacted, continues to demonstrate resilience, and maintain a notable level of transactional activity.

  1. Pepper Pike Capital Partners
  2. Birge & Held
  3. Zidan Management
  4. Yellowstone Property Group
  5. Pedcor Management
  1. TWG Development
  2. Sterling Group
  3. Virtus RE Capital
  4. Brookfield AM
  5. Pepper Pike Capital Partners

*Most Active Buyers and Sellers are based on the sale volume of apartment units.

TRANSACTION VOLUME


YTD Transaction Volume


Y-O-Y Change


Individual Transaction Count


Price Per Unit


Annual Price Change

* Trailing 4Q average PPU

* Preliminary Data from RCA – Individual conventional MF transaction $2.5M +

Economy

In July 2023, the Indianapolis area displayed strong job growth, adding 30,600 new positions according to the Bureau of Labor Statistics (BLS). The job growth rate was 2.7%, a robust figure. Various sectors contributed to this increase. The sector leading in percentage growth was Mining and Logging with a 14.3% increase, albeit from a small base. In terms of sheer numbers, the Leisure and Hospitality sector led the way, adding 6,500 jobs (a growth rate of 5.9%). This was closely followed by the Professional and Business Services sector, which added 6,300 jobs, growing at a rate of 3.3%. The Education and health services sector also posted a significant gain, adding 3,900 jobs at a growth rate of 2.3%.

30.6k

July Annual Jobs Created

2.7%

July 2023 Employment growth

3.6%

July 2023 Unemployment rate
3.8% us July rate

Top 5 Employment Sector Annual Change

Leisure & Hospitality

Leisure & Hospitality

Change from May 2022 to May 2023:
6,500

Percent Change:
5.9%

Professional & Business Services

Professional & Business Services

Change from May 2022 to May 2023:
6,300

Percent Change:
3.3%

Government

Professional & Business Services

Change from May 2022 to May 2023:
5,700

Percent Change:
4.6%

Education & Health Services

Professional & Business Services

Change from May 2022 to May 2023:
3,900

Percent Change:
2.3%

Financial Activities

Financial Activities

Change from May 2022 to May 2023:
3,700

Percent Change:
4.9%

Hover over icons to view data
Tap icons to view data
SectorChange from May 2022 to May 2023 Percent Change
Leisure and hospitality6,500 5.9%
Professional and business services6,300 3.3%
Government5,7004.60%
Education and health services3,900 2.3%
Financial activities3,700 4.9%
Manufacturing3,600 3.8%
Construction2,200 3.6%
Other services700 1.5%
Mining and logging100 14.3%
Information(500)-3.9%
Trade, transportation, and utilities(1,600)-0.7%

Cost of Living Comparison

The cost-of-living index in Indianapolis, IN, registers at an appealing 92.3, denoting a market that provides more affordability compared to the national baseline. A significant contributor to this affordability emanates from the housing sector, which features an index of 78.1 and a median home sales price of $311,200. In a comparative analysis with another major heartland city, Chicago, IL, Indianapolis emerges as a notably cost-effective alternative, providing a 43.6% reduction in housing expenditures and a 19.3% cut in healthcare costs. This amalgamation of financial advantages has cultivated a diverse resident population in Indianapolis, encompassing both families and young professionals, who are drawn to the city’s elevated safety ratings, commendable educational institutions, and a wealth of job opportunities. Furthermore, the city offers ease of navigation, with the majority of downtown being easily accessible either on foot or through public transit.

Chicago, IL vs. Indianapolis, IN
Cost of Living Comparison
Groceries:

5.7% Less
Housing:

43.6% Less
Utilities:

14.5% More
Transportation:

18.0% Less
Health:

19.3% Less
Cost of Living Index

92.3

Index Score

Average Mortgage

$2,407

vs Average Rent: $1,261

Housing

78.1

Index Score

Utilities

106.0

Index Score

Gas

95.7

Index Score

Median Home Sales Price

$311,200

YoY Change: 2.6%

The “Cost of Living” index score provides a comparative assessment of the relative expense involved in maintaining a standard of living in a specific area, benchmarked against a national index score of 100.

Market Outlook

As we venture into the remaining segments of 2023 and beyond, the Indianapolis apartment market displays a future full of potential, firmly grounded by strong economic and substantial job growth. Despite a slight dip in occupancy rates, the market robustly maintains a 93.9% rate, signaling ongoing demand. The notable influx of new units from flourishing submarkets like Carmel and Downtown Indianapolis reflects enduring investor confidence and a horizon for further growth. Additionally, the city has significantly enhanced its appeal as a burgeoning job market due to policies implemented by local leaders, enticing new businesses to establish operations in Indianapolis. This influx of enterprises has introduced a myriad of jobs across various sectors, with the Professional and Business Services sector emerging as a potential future catalyst for apartment demand. Moreover, in terms of rental growth, Indianapolis consistently eclipses many of the nation’s 50 largest apartment markets, showcasing the market’s inherent strength. Collectively, these factors paint an optimistic outlook for the Indianapolis apartment market, embodying both its resilience and potential for growth. Despite the prospect of challenges ahead, the market is robustly equipped to navigate through them, preserving its positive momentum.

Sources: RealPage; BLS; MSCI; The Council for Community And Economic Research (C2ER)

To Gain Further Insights Into The Indianapolis Market Please Reach Out To Our local Team

Image of William Costello

William Costello

Associate Advisor

Have a question?
Send us a message!