
average rent
average occupancy rate
ytd sales volume
YoY rent change
yoy occupancy change
ytd individual transactions
QUARTERLY DEMAND
YTD: -255
QUARTERLY COMPLETIONS
YTD: 1,311


In Q2 2023, the apartment market in Indianapolis rebounded to positive absorption territory, with renters taking up almost 400 net units. Although this figure is slightly below the typical seasonal average for Indianapolis in the second quarter, it underlines the resilience of the local apartment market.
Half of Indianapolis’ submarkets reported positive absorption in Q2 2023. Notably, the East Indianapolis submarket saw the absorption of 311 units, surpassing the 171 units that were introduced during the same period.
In Q2 2023, Indianapolis’ apartment inventory grew by 677 units. Over 70% of this new stock came from the East Indianapolis, Greenwood/Johnson County, and Carmel submarkets.
In recent years, Indianapolis’ suburbs have attracted significant interest from developers. Notably, the Carmel submarket alone contributed 37% of the new stock across the market in the past year.
Over the next four quarters, RealPage anticipates the absorption of 3,016 units, aligning with historical absorption trends.
The Carmel submarket is projected to be a significant demand hotspot, with expected annual demand of 2,148 units.
The apartment market in Indianapolis is set to continue its expansion over the next four quarters, with a substantial projected increase of 5,642 units.
The Carmel and Downtown Indianapolis submarkets are poised to contribute significantly to the new supply, with anticipated additions of 2,909 units and 741 units respectively.
Average Monthly Mortgage Payment
Average Monthly Rent
* The Average mortgage payment is based off a median home sales price of $225,000 as reported by the Indiana Association of Realtors as of May 2023.
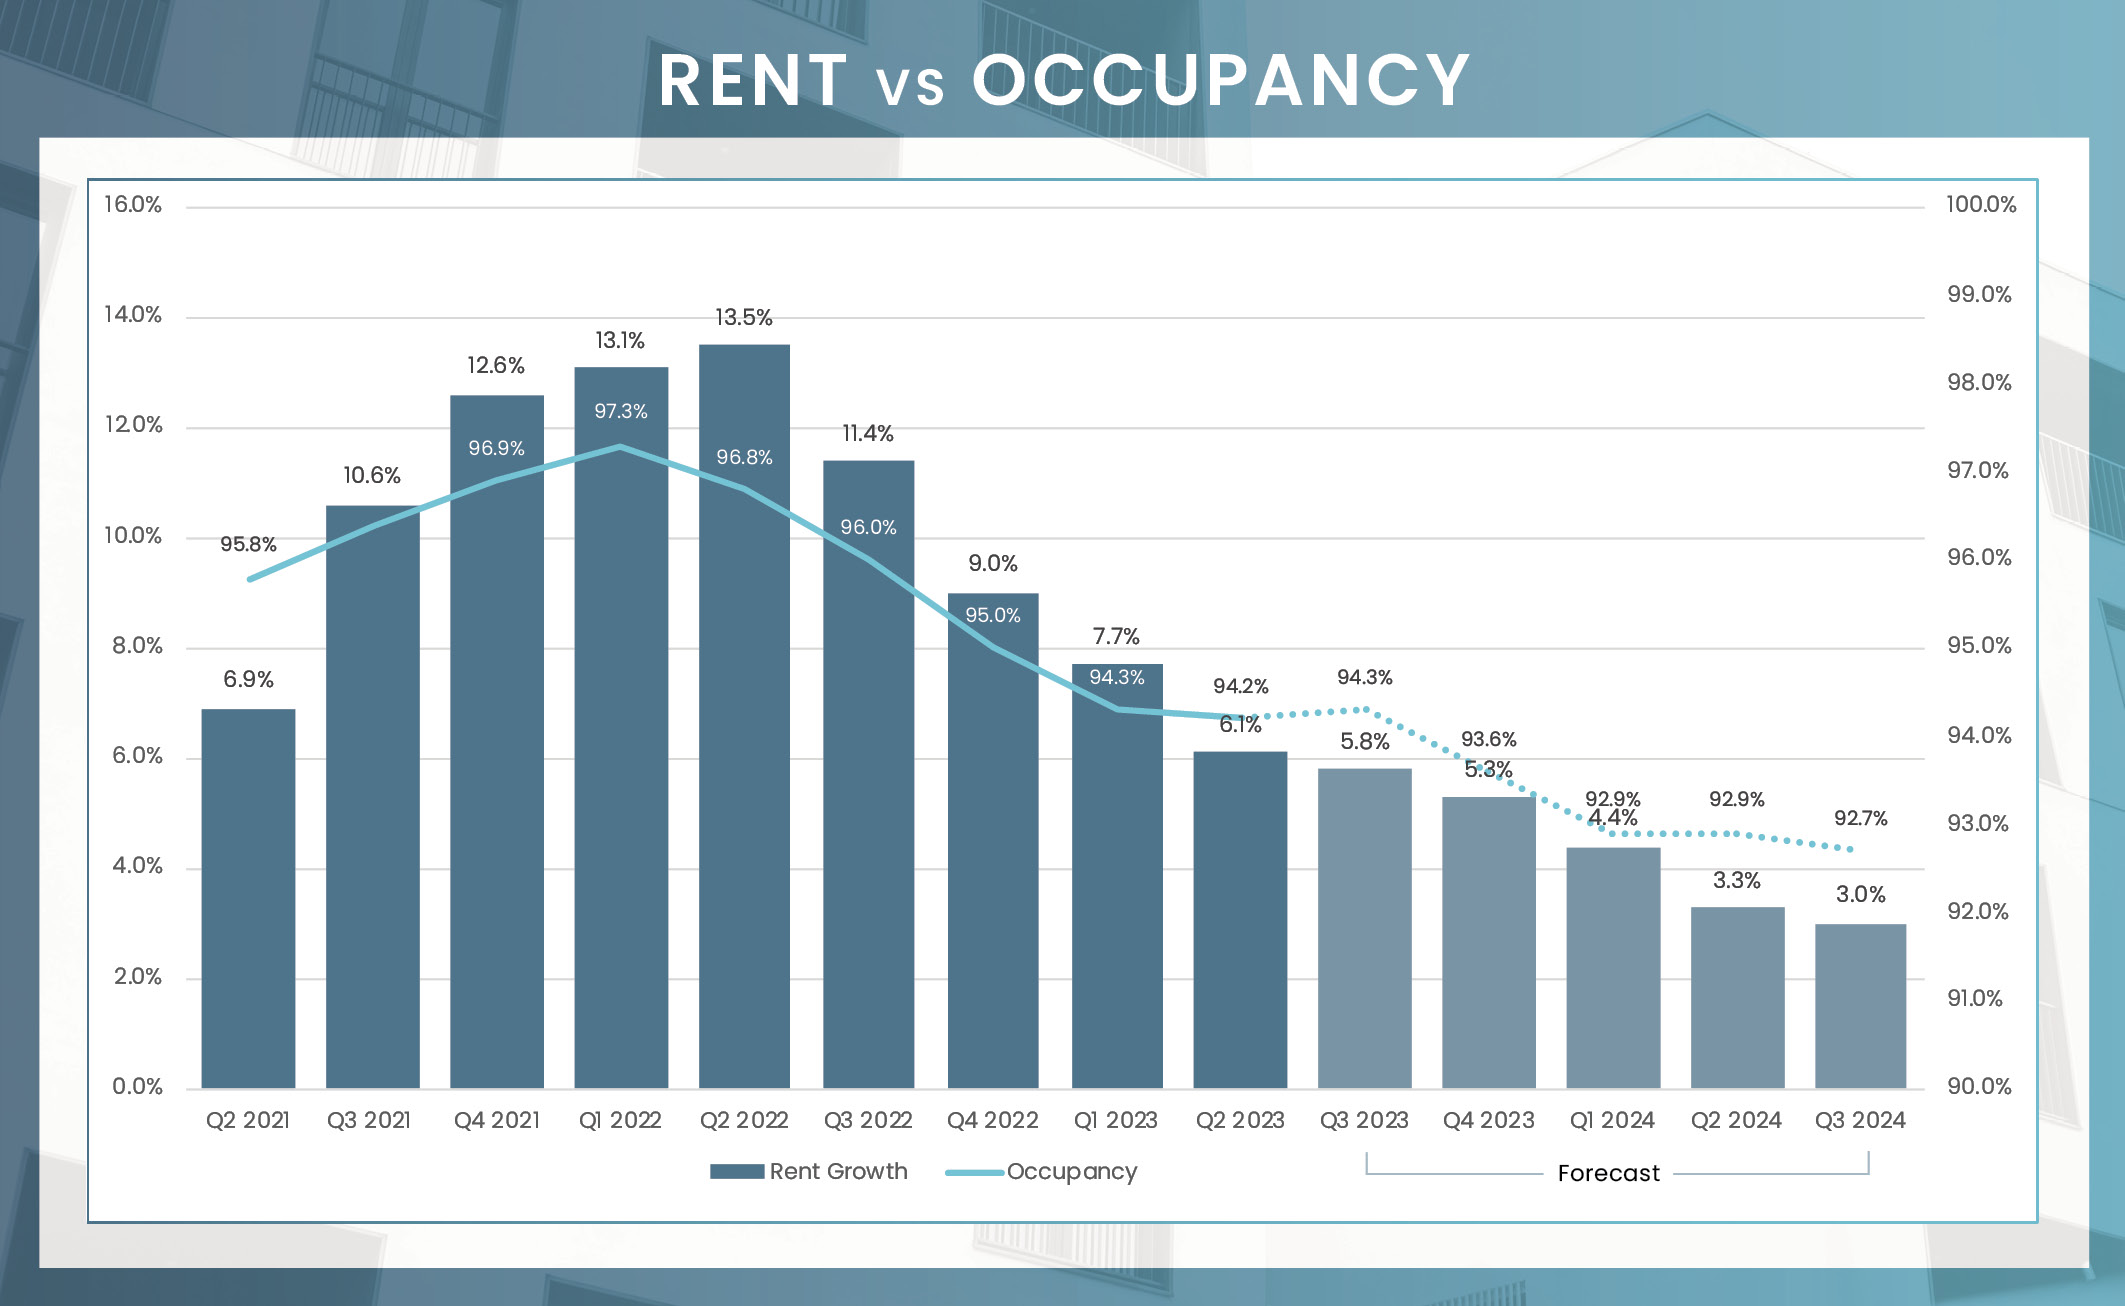
In Q2 2023, Indianapolis apartment operators and investors saw a reason to celebrate as rental demand rebounded into positive territory after four quarters of negative absorption. However, this upturn wasn’t enough to offset the new units added during the quarter, resulting in a slight 10 basis point quarterly drop in the average occupancy rate to 94.2%. Variance was minimal among property classes, with Class C properties on the higher end recording a rate of 94.5%, and Class A units on the lower end registering 93.5%.
Although all thirteen Indianapolis submarkets reported annual decreases in occupancy, the Carmel submarket noted a quarterly increase of 30 basis points, boosting its occupancy to 95.0% in the second quarter. This submarket’s strong demand saw newly occupied units outnumber the 164 that were introduced during this period. On the other hand, among submarkets with an inventory of over 5,000 units, Northeast Indianapolis had experienced a total of 652 net move-outs year-to-date, resulting in the area recording the lowest occupancy rate at 92.7%.
Reflecting trends observed across almost all apartment markets nationwide, the growth rate of rent prices in Indianapolis is decelerating from peak gains seen in the previous year. However, Indianapolis remains an exception in the broader slowdown. Despite the deceleration, it holds the third-highest rate for rent growth among the 50 largest apartment markets in the U.S., registering a growth rate of 6.1% in the second quarter of 2023. This percentage equates to an average rent of $1,249. Moreover, it’s important to note that while many markets are reverting to their long-term averages or even dipping below, Indianapolis continues to outperform its pre-pandemic historical average growth rate of 2.7%.
In terms of property classification, Class C properties experienced the highest annual increase at 7.1%, followed by Class B at 6.2% and Class A at 4.8%. Performance varied among submarkets, with Eagle Creek leading at a growth rate of 9.8% while Greenwood/Johnson County trailed at 3.0%.
| Submarket | Average Occupancy | Annual Occupancy Change | Average Monthly Rent | Annual Rent Change |
|---|---|---|---|---|
| Downtown Indianapolis | 93.6% | -1.3% | $1,568 | 3.9% |
| East Indianapolis | 94.3% | -1.3% | $1,026 | 6.5% |
| Southeast Indianapolis | 94.7% | -1.2% | $1,213 | 4.5% |
| Southwest Indianapolis | 93.7% | -3.4% | $1,070 | 6.5% |
| West Indianapolis | 93.3% | -3.7% | $1,036 | 7.1% |
| Eagle Creek | 94.6% | -2.7% | $1,151 | 9.8% |
| Northwest Indianapolis | 93.6% | -3.5% | $1,127 | 5.0% |
| Northeast Indianapolis | 92.7% | -4.1% | $1,316 | 6.0% |
| Lawrence | 92.5% | -3.8% | $1,194 | 7.4% |
| Greenwood/Johnson County | 95.3% | -2.4% | $1,177 | 2.9% |
| Far West Indianapolis Suburbs | 94.9% | -2.3% | $1,393 | 5.1% |
| Carmel/Hamilton County | 95.0% | -2.2% | $1,502 | 6.1% |
| Anderson | 97.1% | -0.7% | $941 | 6.2% |
Units Under Construction
Units UC Delivering In the Next 4 Quarters
While the substantial drop in conventional multifamily transaction volume between the first halves of 2022 and 2023 might initially draw attention, a closer look at historical data offers a more balanced view. Analyzing transaction activity from the pre-COVID period of 2014 to 2019, the first half volume fluctuated between $127 million in 2014 and $349 million in 2018, averaging $239 million over these six years. With a preliminary figure of $222.8 million for the first half of 2023, it’s clear that despite the challenging capital market conditions, transactions are still being successfully executed. This indicates that the market, although affected, continues to demonstrate resilience, and maintain a substantial level of transactional activity.
* Trailing 4Q average PPU
* Preliminary Data from RCA – Individual conventional MF transaction $2.5M +
In May 2023, the Indianapolis area displayed strong job growth, adding 45,000 new positions according to the Bureau of Labor Statistics (BLS). The job growth rate was 4.0%, a robust figure. Various sectors contributed to this increase. The sector leading in percentage growth was Mining and Logging with a 14.3% increase, albeit from a small base. In terms of sheer numbers, the Professional and Business Services sector led the way, adding 10,300 jobs (a growth rate of 5.5%). This was closely followed by the Leisure and Hospitality sector, which added 7,500 jobs, growing at a rate of 7.0%. The Financial Activities sector also posted a significant gain, adding 2,600 jobs at a growth rate of 3.5%.
May Annual Jobs Created
May 23 Employment growth
May 23 Unemployment rate
3.4% us may rate
Change from May 2022 to May 2023:
10,300
Percent Change:
5.5%
Change from May 2022 to May 2023:
7,500
Percent Change:
7.0%
Change from May 2022 to May 2023:
6,600
Percent Change:
3.9%
Change from May 2022 to May 2023:
5,400
Percent Change:
3.9%
Change from May 2022 to May 2023:
4,100
Percent Change:
1.7%
| Sector | Change from May 2022 to May 2023 | Percent Change |
|---|---|---|
| Professional and business services | 10,300 | 5.50% |
| Leisure and hospitality | 7,500 | 7.00% |
| Education and health services | 6,600 | 3.90% |
| Government | 5,400 | 3.9 |
| Trade, transportation, and utilities | 4,100 | 1.70% |
| Manufacturing | 3,700 | 3.90% |
| Construction | 3,500 | 5.90% |
| Financial activities | 2,600 | 3.50% |
| Other services | 1,200 | 2.70% |
| Mining and logging | 100 | 14.30% |


Looking ahead to the remainder of 2023 and beyond, the Indianapolis apartment market demonstrates a promising trajectory, underpinned by robust economic fundamentals and strong job growth. Although occupancy rates have experienced a minor dip, the market has sustained a healthy rate of above 94%, signaling enduring demand. The notable influx of new units from thriving submarkets like Carmel and Downtown Indianapolis underscores ongoing investor confidence and potential for growth. Indianapolis has also proven itself to be a dynamic job market, adding tens of thousands of jobs across various sectors. Particularly noteworthy is the growth in the Professional and Business Services sector, which could emerge as a key driver for future apartment demand. In terms of rental growth, Indianapolis continues to outperform many of the 50 largest apartment markets in the U.S., signifying the market’s relative strength. Collectively, these factors paint an optimistic outlook for the Indianapolis apartment market, characterized by its resilience and growth potential. While challenges may surface, the market is well-equipped to successfully navigate them and sustain its positive trajectory.


