$1,213 4Q 2023
$1,256 4Q 2024
3.5%
92.0% 4Q 2023
91.6% 4Q 2024
-30 BASIS POINTS
1.16M 2023
1.18M 2024
3.1% 2023
3.8% 2024
* The rent change figure represents the change of the rental rate based on the entire year, beginning to end.
** Please note that these employment figures have been adjusted for seasonal variations and are based on Moody’s Analytics forecast as of January 1, 2024.
*** Please note that these unemployment rates are estimates that have not been adjusted for seasonal variations, and they are derived from Moody’s Analytics forecast as of January 1, 2024.
FORECASTED ABSORPTION
FORECASTED NEW SUPPLY

The Indianapolis apartment market has shown notable resilience and growth over the past year, absorbing approximately 2,200 units. As we progress into 2024, this trend is expected to continue, with a projected absorption increase to 3,378 units. However, this positive absorption trend is slightly overshadowed by the forecasted introduction of 4,864 new units to the market, raising a minor concern of oversupply. Despite this, the current occupancy rate stands strong at 92.0%, with only a marginal anticipated decline to 91.6% by the end of 2024.
A key indicator of this market’s health is the revival of rental demand towards the end of 2023, which has been a promising sign for apartment operators and investors in Indianapolis. This resurgence is particularly evident in the Fishers/Noblesville and Johnson County submarkets. These areas are expected to lead in rental demand, accounting for a combined annual net absorption of 1,305 units, further underlining the market’s ongoing vitality. This balanced view of the market’s prospects reflects both its resilience and the challenges posed by new supply, providing a comprehensive overview of the Indianapolis apartment market as it moves into 2024.
Indianapolis has maintained a consistent yet balanced influx of new apartment developments over the years. In the upcoming four quarters, the market’s apartment market is poised to grow by 4,864 units. Notably, 44% of these new additions are concentrated in the Carmel/Zionsville/Westfield and Fishers/Noblesville submarkets, areas that have traditionally been focal points for developers. The Carmel/Zionsville/Westfield submarket, in particular, is expected to lead in 2024, comprising 28% of the ongoing construction and contributing 1,112 units. Following closely is the Fishers/Noblesville submarket, representing 15% of the total units under construction with 1,031 units. This development trend underscores the continuing allure of Indianapolis’ suburbs for both developers and residents.
Average Monthly Mortgage Payment
Average Monthly Rent
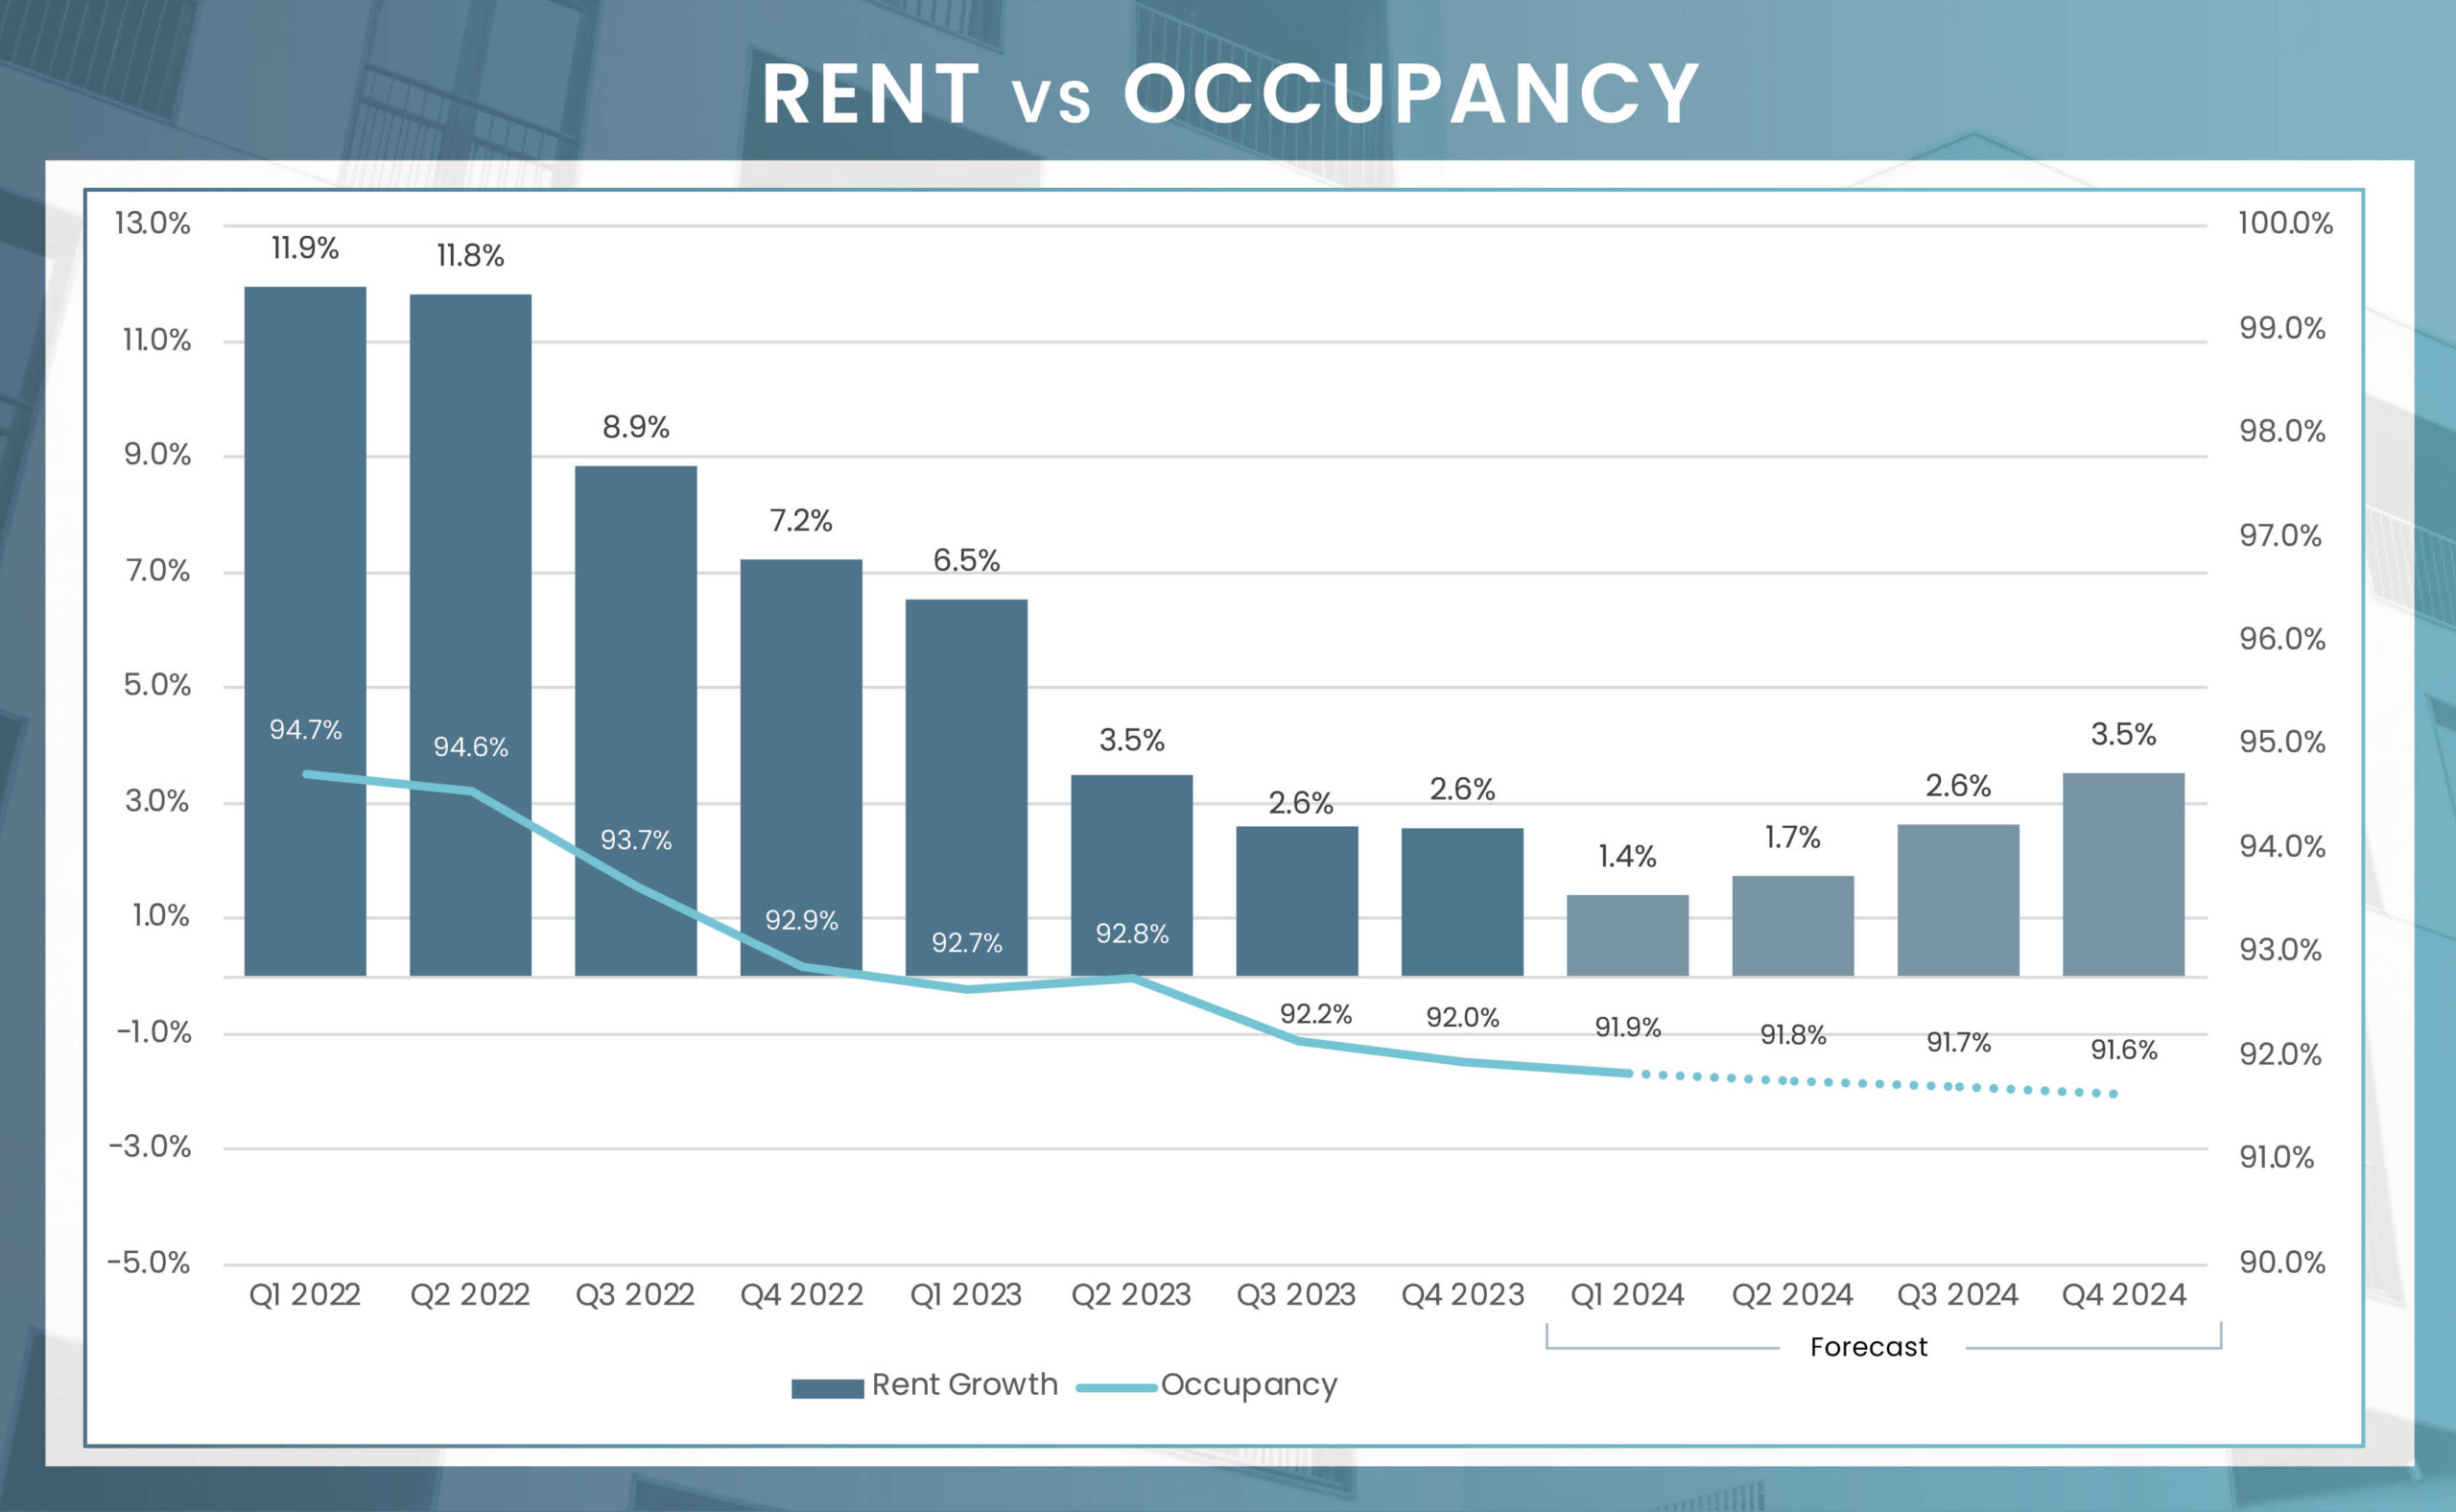
Mirroring the national trend, Indianapolis is experiencing a gradual slowdown in rent growth, with the rate tempering to 2.6%. However, it’s noteworthy that the city is still outpacing the overall U.S. market, where rent growth has dipped to less than one percent. Indianapolis’ ability to surpass the national average can be attributed to several factors, including its diverse economic landscape and relatively more affordable housing. This affordability is highlighted by the comparison of household incomes, which are on par with the national average, while rents in Indianapolis are approximately 25% lower.
As we look ahead to 2024, the forecast suggests a continuation of subdued rent growth in the first half of the year. This trend is expected to shift post-spring, with the momentum likely to increase during the summer leasing season, a period traditionally associated with higher rent growth. By the end of 2024, rent growth in Indianapolis is projected to climb to 3.5%. The performance across Indianapolis’ 24 submarkets will vary, with forecasts ranging from a low of 3.0% in Downtown Indianapolis to a high of 4.3% in Putnam County.
| Submarket | Q4 2023 Stabilized Occupancy | Q4 2024 Stabilized Occupancy (f) | Annual Occupancy Change (2024/2023) | Q4 2023 Average Monthly Rent | Q4 2024 Average Monthly Rent (f) | Annual Rent Change (2024/2023) |
|---|---|---|---|---|---|---|
| Putnam County | 97.5% | 97.3% | -0.2% | $891 | $929 | 4.3% |
| Shelby County | 97.9% | 97.7% | -0.2% | $823 | $858 | 4.3% |
| Morgan County | 96.5% | 96.2% | -0.2% | $856 | $892 | 4.2% |
| Outlying Hamilton County | 96.5% | 96.1% | -0.4% | $946 | $986 | 4.2% |
| Outlying Johnson County | 95.1% | 94.8% | -0.3% | $1,355 | $1,411 | 4.1% |
| South Madison County | 94.0% | 93.7% | -0.3% | $1,274 | $1,325 | 4.0% |
| North Madison County | 97.9% | 97.7% | -0.2% | $867 | $901 | 4.0% |
| Downtown Plainfield | 93.8% | 93.6% | -0.2% | $1,402 | $1,458 | 4.0% |
| Brown County | 93.5% | 93.1% | -0.4% | $656 | $682 | 3.9% |
| Anderson | 91.0% | 90.6% | -0.5% | $889 | $924 | 3.9% |
| Hancock County | 95.5% | 95.4% | -0.1% | $1,279 | $1,329 | 3.9% |
| South Marion County | 92.6% | 92.3% | -0.3% | $1,149 | $1,192 | 3.7% |
| Southeast Indianapolis | 92.4% | 92.1% | -0.4% | $1,125 | $1,166 | 3.7% |
| Carmel/Zionsville/Westfield | 93.6% | 93.5% | -0.1% | $1,544 | $1,599 | 3.6% |
| Johnson County | 94.8% | 94.6% | -0.2% | $1,202 | $1,245 | 3.6% |
| Outlying Hendricks County | 89.2% | 88.6% | -0.7% | $707 | $733 | 3.6% |
| Central Marion County | 90.0% | 89.5% | -0.5% | $985 | $1,019 | 3.5% |
| Fishers/Noblesville | 94.1% | 93.9% | -0.2% | $1,437 | $1,487 | 3.5% |
| Inner Hendricks County | 94.8% | 94.6% | -0.2% | $1,428 | $1,478 | 3.5% |
| North Washington Township | 89.6% | 89.2% | -0.4% | $1,249 | $1,292 | 3.4% |
| Northwest Marion County | 93.5% | 93.2% | -0.3% | $1,120 | $1,159 | 3.4% |
| Northeast Marion County | 86.8% | 86.4% | -0.5% | $1,142 | $1,180 | 3.4% |
| Outlying Boone County | 95.3% | 95.1% | -0.2% | $1,339 | $1,383 | 3.3% |
| Downtown Indianapolis | 91.6% | 91.3% | -0.3% | $1,481 | $1,526 | 3.0% |
| Market | 92.0% | 91.6% | -0.3% | $1,213 | $1,256 | 3.5% |
4Q 2023 Unit Inventory
Number of Units Under Construction
Number of Units UC Delivering
In the Next 4 Quarters
| Submarket | Unit Inventory: 4Q 2023 | Units Under Construction | % of Existing Inventory UC | % of Total UC | Units UC Delivering In the Next 4 Quarters |
|---|---|---|---|---|---|
| Anderson | 2,346 | 0 | 0% | 0.0% | 0 |
| Brown County | 15 | 0 | 0% | 0.0% | 0 |
| Carmel/Zionsville/Westfield | 12,853 | 2,530 | 20% | 28.2% | 1,112 |
| Central Marion County | 33,359 | 735 | 2% | 8.2% | 507 |
| Downtown Indianapolis | 11,143 | 1,175 | 11% | 13.1% | 370 |
| Downtown Plainfield | 2,995 | 300 | 10% | 3.3% | 0 |
| Fishers/Noblesville | 11,504 | 1,344 | 12% | 15.0% | 1,031 |
| Hancock County | 2,404 | 589 | 25% | 6.6% | 252 |
| Inner Hendricks County | 5,668 | 709 | 13% | 7.9% | 608 |
| Johnson County | 8,838 | 346 | 4% | 3.9% | 118 |
| Morgan County | 733 | 0 | 0% | 0.0% | 0 |
| North Madison County | 421 | 0 | 0% | 0.0% | 0 |
| North Washington Township | 13,953 | 657 | 5% | 7.3% | 421 |
| Northeast Marion County | 10,370 | 0 | 0% | 0.0% | 0 |
| Northwest Marion County | 19,643 | 150 | 1% | 1.7% | 0 |
| Outlying Boone County | 3,297 | 44 | 1% | 0.5% | 43 |
| Outlying Hamilton County | 221 | 0 | 0% | 0.0% | 0 |
| Outlying Hendricks County | 66 | 0 | 0% | 0.0% | 0 |
| Outlying Johnson County | 569 | 0 | 0% | 0.0% | 0 |
| Putnam County | 395 | 0 | 0% | 0.0% | 0 |
| Shelby County | 1,144 | 0 | 0% | 0.0% | 0 |
| South Madison County | 261 | 0 | 0% | 0.0% | 0 |
| South Marion County | 12,516 | 0 | 0% | 0.0% | 0 |
| Southeast Indianapolis | 10,454 | 404 | 4% | 4.5% | 402 |
| Market | 165,168 | 8,983 | 5% | 100.0% | 4,864 |
As we enter 2024, the multifamily investment scene in Indianapolis can be described as moderately active. The final quarter of 2023 concluded with a total of seven individual assets changing hands, amounting to $207.5 million. The overall transaction volume for the year comprised 31 deals, amounting to $676.8 million. This represents a 57% decline from the previous year. In terms of the 2023 transactions, there was a noticeable shift in the buyer profile. Looking ahead, the Indianapolis market retains its attractiveness, largely thanks to its robust job growth and relative affordability. These elements are anticipated to offer attractive opportunities, particularly if interest rates find a stable footing. While investors might initially approach with caution, potentially biding their time for pricing adjustments in the near future, the latter half of the year will likely see an uptick in transaction activity in the Indianapolis market.
*Most Active Buyers and Sellers are based on the sale volume of apartment units.
* Trailing 4Q average PPU
* Preliminary Data from RCA – Individual transaction $2.5M +
P=Preliminary

| Sector | Employment Change 2023 to 2024 | Percent Change |
|---|---|---|
| Overall Employment | 16,100 | 1.4% |
| Manufacturing | 1,700 | 1.7% |
| Construction | 100 | 0.0% |
| Trade, Transport., & Utilities | 1,600 | 0.7% |
| Information | 0 | 0.0% |
| Financial Activities | 1,300 | 1.7% |
| Professional & Business Services | 1,700 | 0.9% |
| Education & Health Services | 4,600 | 2.6% |
| Government | 1,000 | 0.8% |
| Leisure & Hospitality | 3,600 | 3.2% |
| Natural Resources & Mining | 100 | 0.0% |
| Other Services | 300 | 0.7% |
The Indianapolis apartment market is entering 2024 with strong growth prospects, underpinned by the city’s thriving job market and overall economic health. The metro area is on track to add approximately 16,100 new jobs by the end of the year, reflecting a 1.4% increase. This job creation is a significant driver of economic vitality, particularly in burgeoning submarkets such as Carmel and Downtown Indianapolis.
Contributing to this economic dynamism are major corporations like Corteva, Elanco, Rolls-Royce, and Eli Lilly. Their presence establishes Indianapolis as a key job center, with a notable emphasis on the Professional and Business Services sector. This influx of jobs and corporate investment is a critical factor in bolstering apartment demand within the market. The convergence of these positive trends—robust job creation, the expansion of key submarkets, and the presence of major industry players—points to a promising future for the Indianapolis apartment market, characterized by ongoing progress and stability.