
The Federal Reserve has been on a course of incrementally increasing interest rates for over a year now, with the aim of tempering the highest inflation rates witnessed since the ’80s. However, the uneven rise in inflation across various regions of the country underscores the challenges faced by policymakers in managing price fluctuations. Economists assert that the housing sector remains the key determinant of regional disparities in inflation. Therefore, it is crucial to delve into these regional variances to gain a more comprehensive understanding of the local impacts and identify the areas where the economic strain from escalating prices is most severe. Ultimately, the United States does not operate as a singular economy but is comprised of thousands of regional economies, each influenced by its own set of supply and demand forces, wage levels, legal frameworks, governmental policies, and geographical distinctions that collectively shape the local economic landscape.
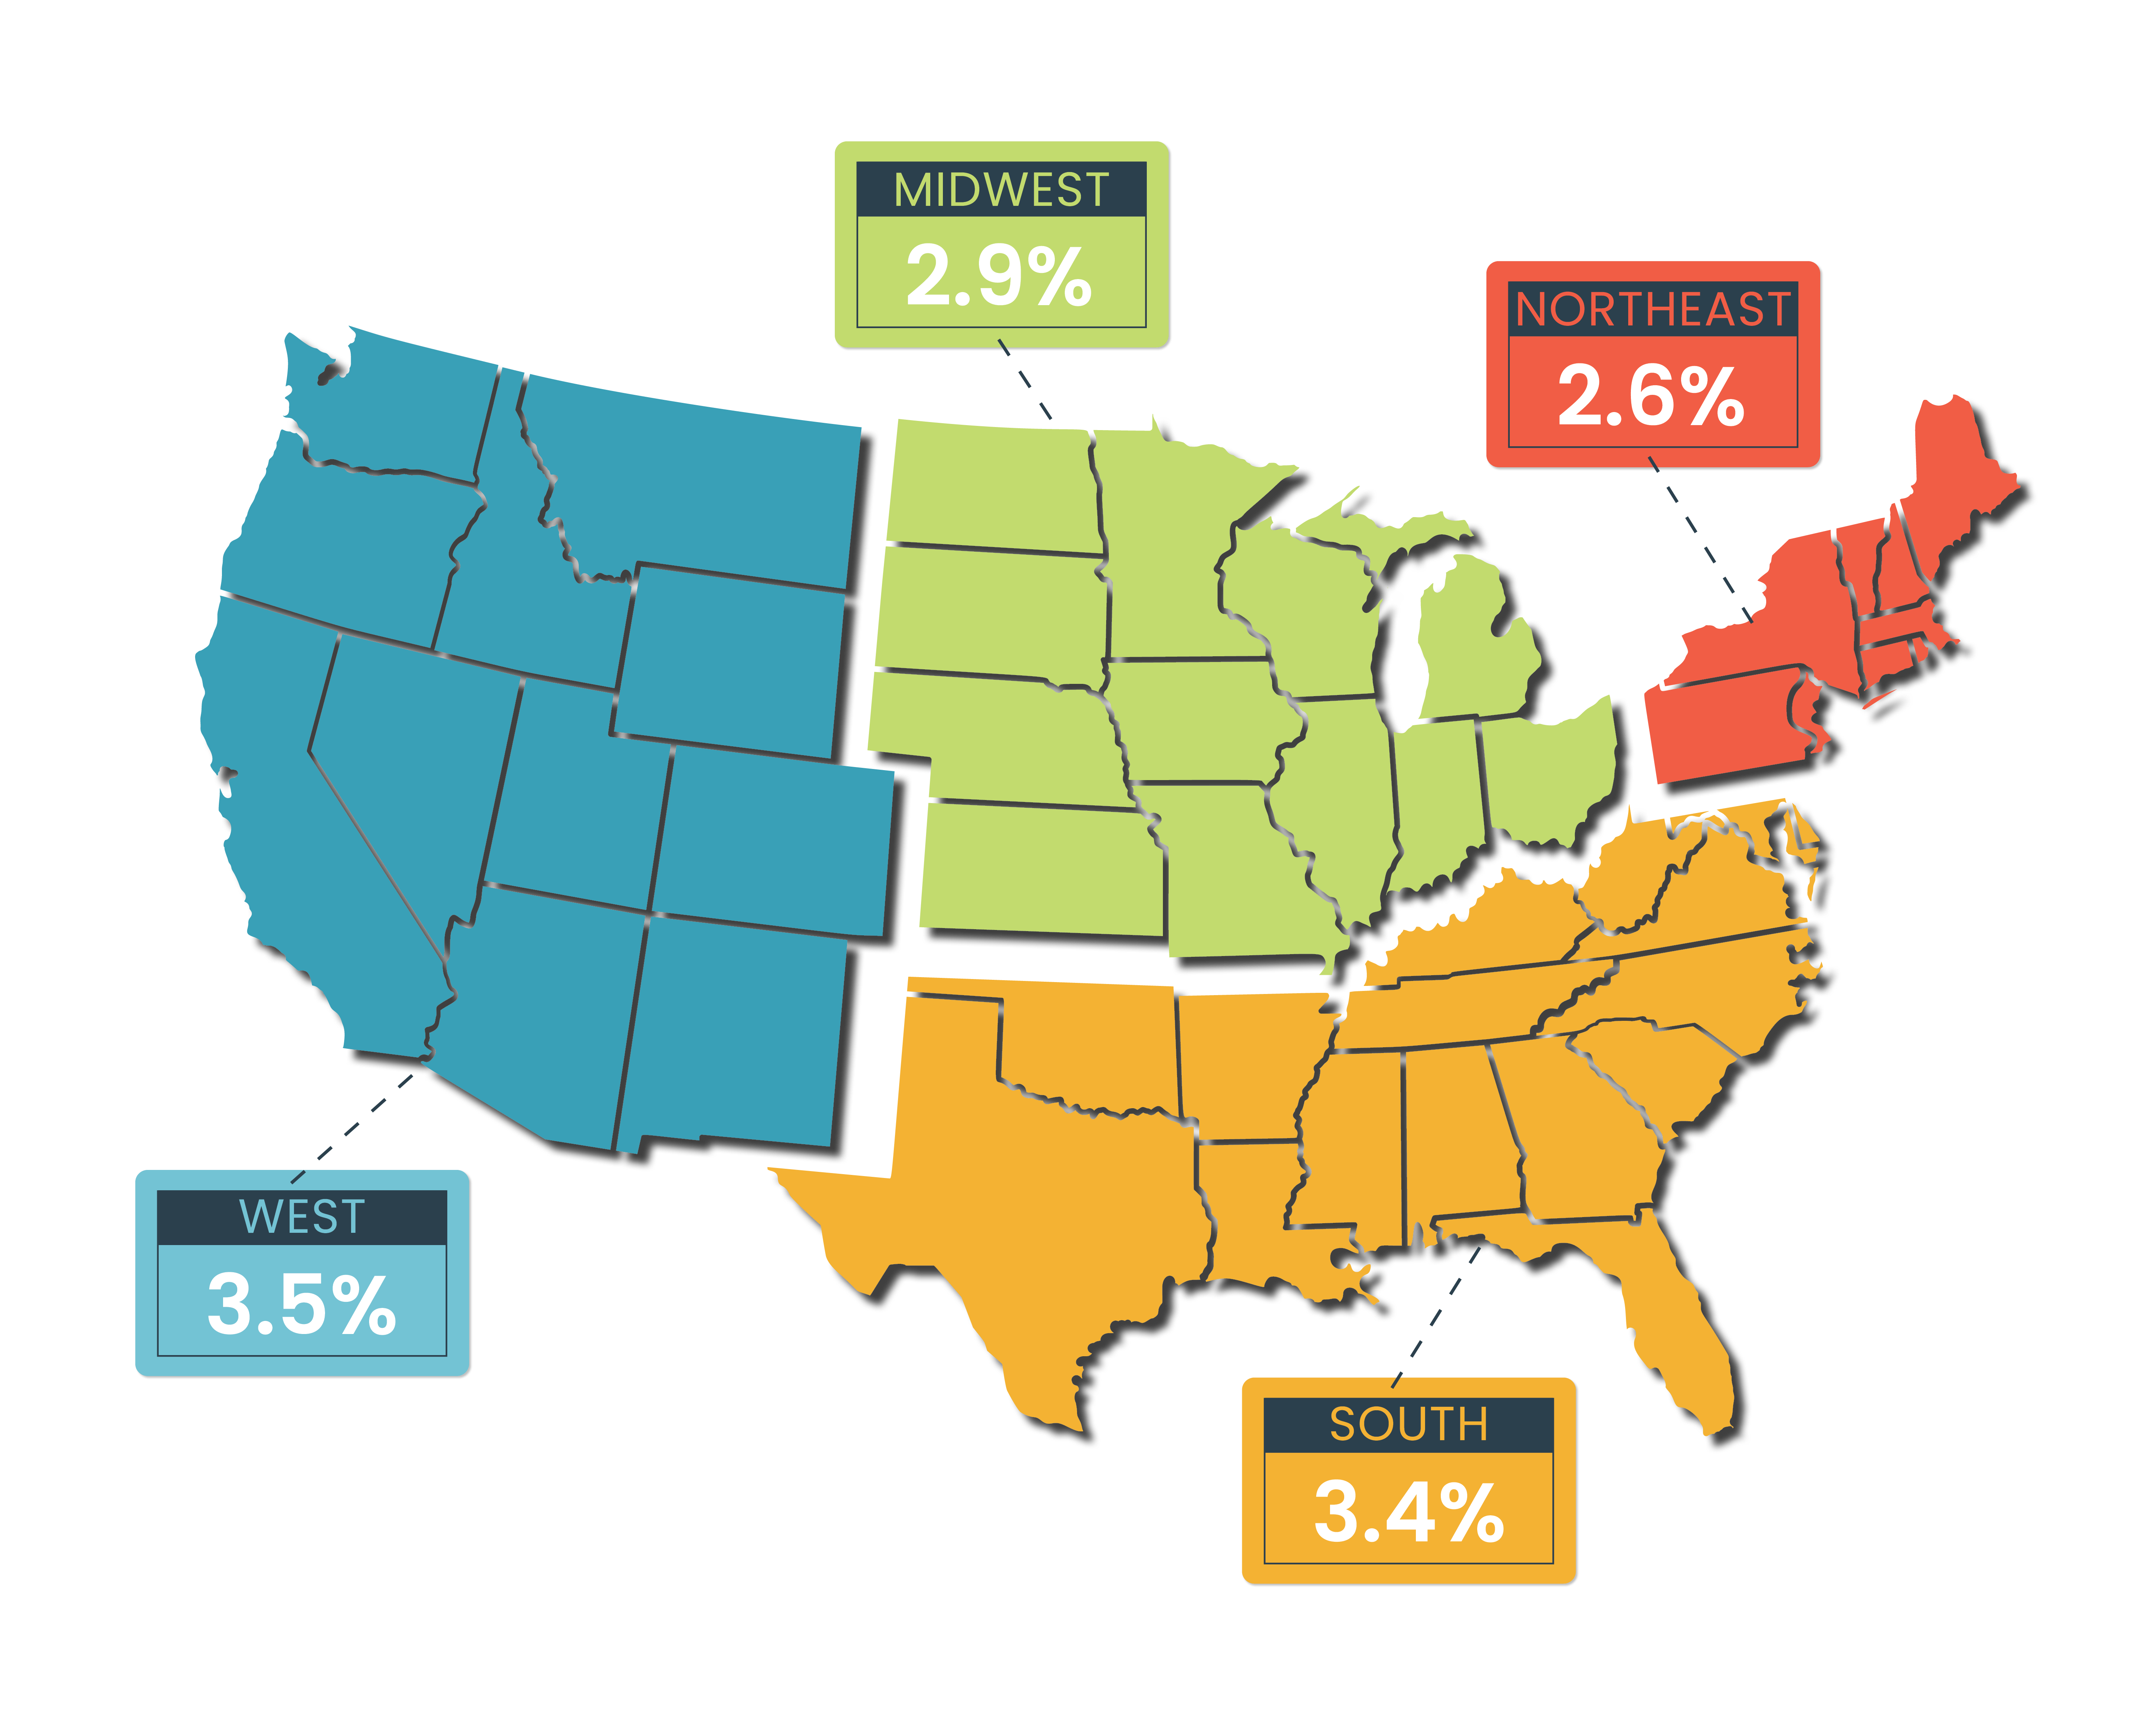
The chief element influencing the regional differences in inflation is the housing sector. For example, the residents in the Midwest generally allocate a lesser portion of their income for housing compared to those in the Northeast or West. Since the housing sector has been a significant contributor in the recent upsurge of inflation, the Midwest has witnessed relatively restrained inflation this year, as noted by economists at the Federal Reserve Bank of Chicago. On the other hand, many sunbelt cities have seen a surge in population in recent years due to internal migration, leading to increased rents and property prices throughout those regions.
Although inflation has shown signs of cooling, it’s still heightened in some of America’s biggest cities. To evaluate the regions where inflation accelerated most rapidly, we analyzed the latest Consumer Price Index for All Urban Consumers (CPI-U) from the Bureau of Labor Statistics, comparing the percent change from Jul 2022 to July[1] 2023, across 23 major metropolitan areas. As of July, the average inflation increase for US cities stood at 3.2%. Miami, FL, recorded the highest inflation rate, increasing by 6.9%, followed by Tampa, FL, at 5.9%. Detroit, MI, and Denver, CO, were tied for third place at 4.7%. Conversely, the metropolitan areas with the slowest inflation growth were Minneapolis, MN, at 1.0%, Houston, TX, at 1.7%, and Washington, DC, at 1.8%. Remarkably, Urban Alaska was the sole metropolitan area to register a decline in inflation, dropping by 3.3%.
| Rank | Metro | CPI [Percent change from Jul 2022 to Jul. 2023] |
|---|---|---|
| 1 | Miami-Fort Lauderdale-West Palm Beach, FL | 6.9% |
| 2 | Tampa-St. Petersburg-Clearwater, FL | 5.9% |
| 3 | Detroit-Warren-Dearborn, MI | 4.7% |
| 4 | Denver-Aurora-Lakewood, CO | 4.7% |
| 5 | Atlanta-Sandy Springs-Roswell, GA | 4.6% |
| 6 | Seattle-Tacoma-Bellevue, WA | 4.6% |
| 7 | Phoenix-Mesa-Scottsdale, AZ | 4.4% |
| 8 | San Diego-Carlsbad, CA | 4.3% |
| 9 | Dallas-Fort Worth-Arlington, TX | 4.0% |
| 10 | Riverside-San Bernardino-Ontario, CA | 3.4% |
| 11 | Philadelphia-Camden-Wilmington, PA-NJ-DE-MD | 3.1% |
| 12 | St. Louis, MO-IL | 3.1% |
| 13 | San Francisco-Oakland-Hayward, CA | 2.9% |
| 14 | Baltimore-Columbia-Towson, MD | 2.8% |
| 15 | Boston-Cambridge-Newton, MA-NH | 2.8% |
| 16 | Los Angeles-Long Beach-Anaheim, CA | 2.5% |
| 17 | New York-Newark-Jersey City, NY-NJ-PA | 2.5% |
| 18 | Chicago-Naperville-Elgin, IL-IN-WI | 2.1% |
| 19 | Urban Hawaii | 2.1% |
| 20 | Washington-Arlington-Alexandria, DC-VA-MD-WV | 1.8% |
| 21 | Houston-The Woodlands-Sugar Land, TX | 1.7% |
| 22 | Minneapolis-St. Paul-Bloomington, MN-WI | 1.0% |
| 23 | Urban Alaska | -3.3% |
Source: BLS; Consumer Price Index for All Urban Consumers (CPI-U): Selected areas, all items index, July 2023
