average rent
average occupancy rate
ytd sales volume
YoY rent change
yoy occupancy change
ytd individual transactions
QUARTERLY DEMAND
YTD: 12,242
QUARTERLY COMPLETIONS
YTD: 14,004


Average Monthly Mortgage Payment
Average Monthly Rent
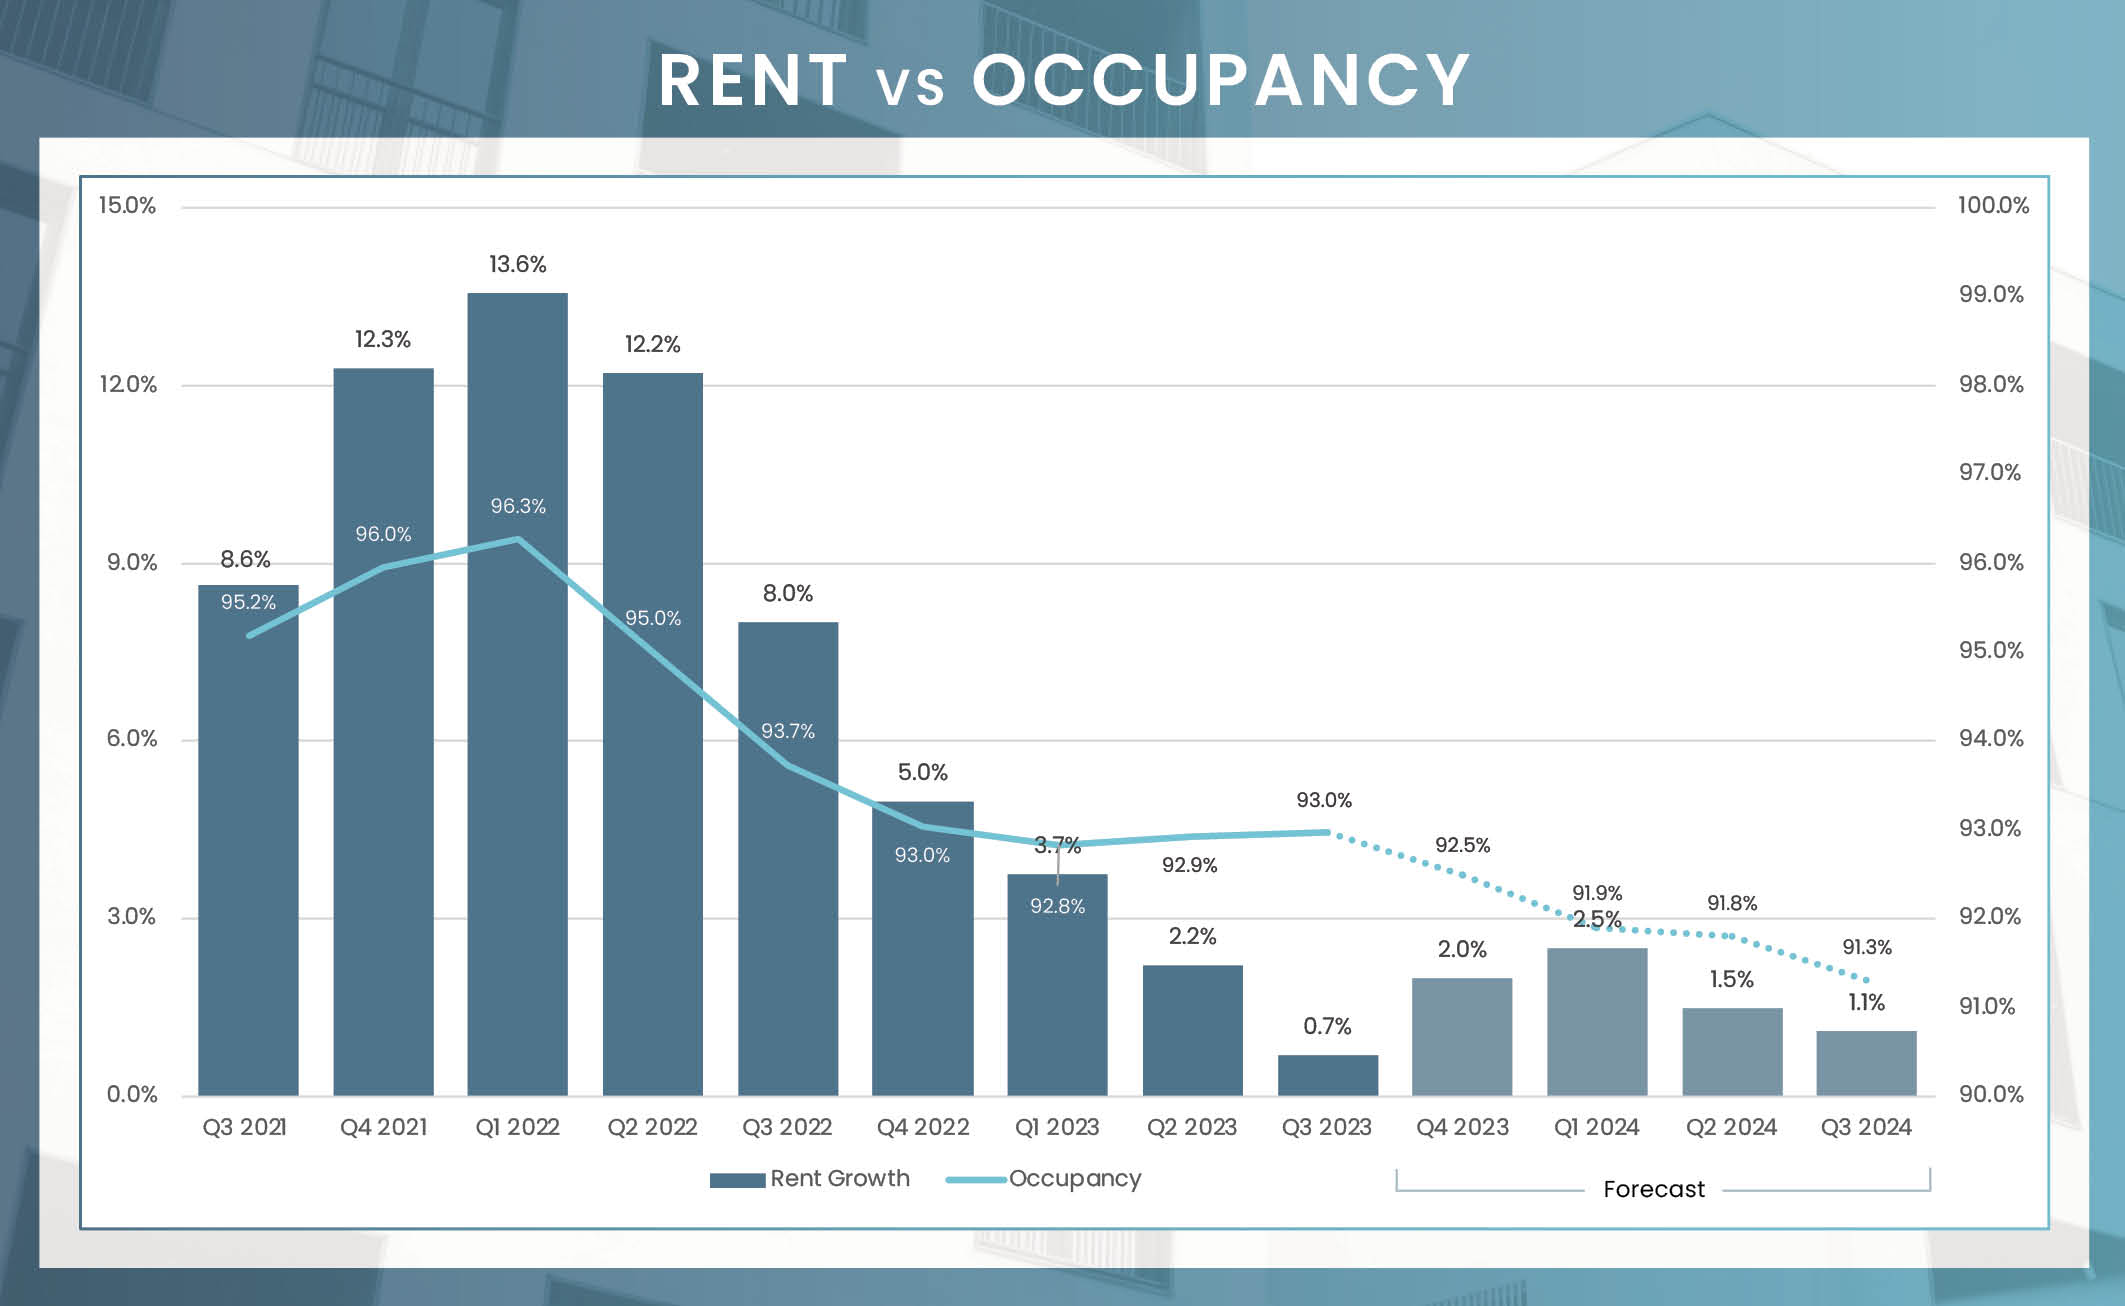
As of the third quarter in 2023, the overarching occupancy rate for apartments in Houston stood at a respectable 93.0%. This figure is aligned with the market’s historical mean of 92.7%. In terms of the class segmentation, Class A apartments showed the strongest occupancy, clocking in at 93.5%. This rate slightly surpassed the figures for both Class B and Class C units, which were 93.0% and 92.6% respectively. From a submarket perspective, the highest occupancy levels were observed in West University/Medical Center/Third Ward, Gulfton/Westbury, and Sugar Land/Stafford. Each of these regions boasted rates of 94.4% or even higher. On the other end of the spectrum, submarkets such as Far West Houston, Pasadena/Southeast Houston, Baytown, Braeswood Place/Astrodome/South Union, and North Central Houston reported occupancy levels trailing below the 92% mark. These figures emphasize the nuances and distinct dynamics across Houston’s varied submarkets.
Houston’s rental market witnessed subdued growth in the third quarter of 2023. The broader Houston-The Woodlands-Sugar Land region saw a modest 0.6% annual increase in new lease rents. When breaking down by product classes, Class A units registered an uptick of 0.8%, Class B units trailed slightly at 0.4%, and Class C properties led the pack with a 0.9% growth.
In terms of geographical rent dynamics, submarkets with limited new supply, such as Sharpstown/Fondren Southwest, Alief, and North Central Houston, exhibited the most robust rent growth. This emphasizes the inverse relationship between supply and rent escalation. It’s noteworthy that 11 out of Houston’s 35 submarkets experienced a dip in annual effective rent in the year-ending third quarter, indicating pockets of potential oversupply or other localized factors affecting demand.
| Submarket | Average Occupancy | Annual Occupancy Change | Average Monthly Rent | Annual Rent Change |
|---|---|---|---|---|
| Downtown/Montrose/River Oaks | 93.1% | 0.8% | $2,113 | -0.2% |
| West University/Medical Center/Third Ward | 94.8% | 0.5% | $2,031 | 2.4% |
| Greenway/Upper Kirby | 93.1% | 0.1% | $2,063 | 1.0% |
| Greater Heights/Washington Avenue | 93.3% | -0.6% | $1,831 | -0.3% |
| East Inner Loop | 94.2% | 1.9% | $1,439 | 1.2% |
| Braeswood Place/Astrodome/South Union | 91.8% | -0.5% | $1,366 | -1.8% |
| Galleria/Uptown | 92.6% | -0.4% | $1,500 | -1.3% |
| Westchase | 92.0% | -1.3% | $1,194 | 0.9% |
| Memorial | 93.9% | 1.3% | $1,744 | 0.6% |
| Spring Branch | 93.2% | -1.8% | $1,265 | 0.6% |
| Northwest Houston | 93.0% | -0.8% | $1,066 | 3.3% |
| North Central Houston | 91.8% | -2.4% | $975 | 4.6% |
| Northeast Houston | 93.0% | 0.7% | $1,178 | -0.2% |
| Pasadena/Southeast Houston | 91.7% | -1.0% | $1,061 | 1.7% |
| Hobby Airport | 93.0% | -0.8% | $971 | 2.9% |
| Gulfton/Westbury | 94.6% | -1.4% | $1,062 | 2.1% |
| Sharpstown/Fondren Southwest | 93.8% | -1.8% | $939 | 6.3% |
| Alief | 93.7% | 0.1% | $1,065 | 5.3% |
| Far West Houston | 91.5% | -1.1% | $1,255 | 0.2% |
| Bear Creek | 93.3% | -0.4% | $1,329 | 1.1% |
| Katy | 94.0% | -0.8% | $1,557 | -0.6% |
| Cypress/Waller | 92.2% | -2.2% | $1,531 | -1.8% |
| Champions West | 93.1% | -0.9% | $1,320 | 1.0% |
| Champions East | 92.1% | -0.8% | $1,100 | 2.6% |
| Spring/Tomball | 93.4% | -1.3% | $1,415 | 0.0% |
| The Woodlands | 93.7% | -0.5% | $1,546 | -1.5% |
| Conroe/Montgomery County | 93.1% | -1.6% | $1,273 | -1.1% |
| Humble/Kingwood | 92.0% | -2.1% | $1,349 | 0.1% |
| Baytown | 91.8% | -1.9% | $1,109 | 1.3% |
| Clear Lake | 93.4% | -0.2% | $1,303 | 0.8% |
| Galveston/Texas City | 92.4% | -1.7% | $1,271 | 2.5% |
| Friendswood/Pearland | 93.3% | -0.7% | $1,485 | 0.3% |
| Brazoria County | 92.2% | 0.0% | $1,109 | 1.0% |
| Sugar Land/Stafford | 94.4% | -0.1% | $1,501 | -0.5% |
| Rosenberg/Richmond | 93.0% | -1.0% | $1,449 | -0.5% |
Number of Units Under Construction
Number of Units UC Delivering In the Next 4 Quarters
| Submarket | Units Under Construction | % of Total UC | Units UC Delivering In the Next 4 Quarters |
|---|---|---|---|
| Downtown/Montrose/River Oaks | 2,095 | 6% | 1,438 |
| West University/Medical Center/Third Ward | 134 | 0% | 0 |
| Greenway/Upper Kirby | 511 | 2% | 302 |
| Greater Heights/Washington Avenue | 1,852 | 6% | 880 |
| East Inner Loop | 1,936 | 6% | 1,706 |
| Braeswood Place/Astrodome/South Union | 0 | 0% | 0 |
| Galleria/Uptown | 172 | 1% | 0 |
| Westchase | 221 | 1% | 81 |
| Memorial | 634 | 2% | 394 |
| Spring Branch | 1,725 | 5% | 530 |
| Northwest Houston | 1,040 | 3% | 639 |
| North Central Houston | 240 | 1% | 240 |
| Northeast Houston | 166 | 0% | 166 |
| Pasadena/Southeast Houston | 340 | 1% | 340 |
| Hobby Airport | 699 | 2% | 699 |
| Gulfton/Westbury | 332 | 1% | 332 |
| Sharpstown/Fondren Southwest | 0 | 0% | 0 |
| Alief | 461 | 1% | 120 |
| Far West Houston | 0 | 0% | 0 |
| Bear Creek | 1,688 | 5% | 1,688 |
| Katy | 3,240 | 10% | 2,599 |
| Cypress/Waller | 1,833 | 5% | 1,305 |
| Champions West | 610 | 2% | 610 |
| Champions East | 336 | 1% | 336 |
| Spring/Tomball | 3,052 | 9% | 2,106 |
| The Woodlands | 1,141 | 3% | 711 |
| Conroe/Montgomery County | 1,759 | 5% | 1,346 |
| Humble/Kingwood | 1,069 | 3% | 917 |
| Baytown | 0 | 0% | 0 |
| Clear Lake | 1,031 | 3% | 813 |
| Galveston/Texas City | 296 | 1% | 296 |
| Friendswood/Pearland | 111 | 0% | 0 |
| Brazoria County | 603 | 2% | 393 |
| Sugar Land/Stafford | 1,344 | 4% | 965 |
| Rosenberg/Richmond | 2,980 | 9% | 2,920 |
| Houston | 33,651 | 100% | 24,872 |
In 2023, the Houston multifamily market observed a marked reduction in transactional activity. Dollar volumes for single asset conventional multifamily sales totaled approximately $1.5 billion through the third quarter, reflecting a substantial 75% decline from the corresponding period the previous year. This drop was further emphasized by a significant decrease in the number of transactions, with over 100 fewer deals made compared to last year. In total, only 40 apartment properties exchanged ownership this year. From a pricing perspective, the average price per unit for Houston apartments was approximately $147,100. This figure indicates a 7% annual dip. When contrasted with broader regional and national metrics, Houston’s average price per unit was notably lower. Specifically, the price was about 25% beneath the average for the Southern region, which stood at $197,200, and was around 33% below the U.S. national average of $219,700.
*Most Active Buyers and Sellers are based on the sale volume of apartment units.
* Transaction data is for the whole Metroplex
* Trailing 4Q average PPU
* Preliminary Data from RCA – Individual conventional MF transaction $2.5M +
Between August 2022 and August 2023, Houston’s labor market exhibited dynamic growth across multiple sectors, according to BLS data. The Trade, Transportation, and Utilities sector led the surge, adding 25,500 positions, a 3.8% increase from the previous year. This was closely followed by the Education and Health Services sector, which expanded by 22,600 jobs, representing a robust 5.3% growth. Other notable sectors include Professional and Business Services with an additional 11,500 roles, and Financial Activities, which grew by 4.4%, adding 8,000 jobs. Despite the overall positive momentum, the Construction sector faced challenges, witnessing a decrease of 6,800 jobs or a 3.0% contraction. Overall, Houston’s employment landscape underscores its resilience and diverse economic foundation.
August Annual Jobs Created
August 2023 Employment growth
August 2023 Unemployment rate
3.8% us August rate
Change from August 2022 to August 2023:
25,500
Percent Change:
3.8%
Change from August 2022 to August 2023:
22,600
Percent Change:
5.3%
Change from August 2022 to August 2023:
11,500
Percent Change:
2.1%
Change from August 2022 to August 2023:
8,400
Percent Change: 2.4%
Change from August 2022 to August 2023:
8,000
Percent Change:
4.4%
| Sector | Change from August 2022 to August 2023 | Percent Change |
|---|---|---|
| Trade, transportation, and utilities | 25,500 | 3.8% |
| Education and health services | 22,600 | 5.3% |
| Professional and business services | 11,500 | 2.1% |
| Leisure and hospitality | 8,400 | 2.4% |
| Financial activities | 8,000 | 4.4% |
| Manufacturing | 7,200 | 3.2% |
| Government | 6,600 | 1.6% |
| Mining & logging | 3,500 | 5.3% |
| Other services | 1,000 | 0.8% |
| Information | 100 | 0.3% |
| Construction | (6,800) | -3.0% |
Living in Houston presents a more affordable option compared to Dallas. Specifically, Houston residents enjoy a 14.9% lower housing cost and spend 10.2% less on utilities. While transportation costs are slightly higher by 6.4% in Houston, groceries and health expenses are respectively 1.6% and 16.0% lower than in Dallas. With a median home sales price of $333,000 and average rents at $1,367, Houston offers a balanced blend of cost advantages in key living expenses.
92.3
$3,625
88.7
102.4
84.9
$333,000
The “Cost of Living” index score provides a comparative assessment of the relative expense involved in maintaining a standard of living in a specific area, benchmarked against a national index score of 100.
Source: COLI; BLS; Consumer Price Index for All Urban Consumers (CPI-U): Selected areas, all items index, July 2023
Houston’s multifaceted economic transformation, which expanded beyond the energy sector, brought forth gains for the Houston apartment market. Yet, looming challenges on the horizon cannot be ignored. A testament to Houston’s rapid growth, the metro is set to retain its position as a national frontrunner in construction, with an impressive 24,872 apartment units earmarked for completion in the upcoming year. These new deliveries will be predominantly concentrated in the Rosenberg/Richmond, Katy, and Spring/Tomball submarkets. Consequently, a considerable period might be needed apartment operators can push pricing the owners are use to seeing in Houston. However, there’s a silver lining: the constrained availability in the single-family housing sector could bolster demand for Class A apartments.
In the short term, challenges such as these may position Houston’s occupancy and rent growth metrics at the bottom spectrum nationally throughout 2024. Yet, the future looks promising. Post-2024 projections suggest that Houston could align with national averages. Still, it’s crucial to note that, relative to other Sun Belt regions, Houston’s market showcases greater volatility. As such, stakeholders and investors should exercise caution and conduct thorough market analyses before making significant decisions.