$1,301 4Q 2023
$1,333 4Q 2024
2.5%
91.0% 4Q 2023
90.7% 4Q 2024
-30 points
3.35M 2023
3.42M 2024
4.4% 2023
4.2% 2024
* Please note that these employment figures have been adjusted for seasonal variations and are based on Moody’s Analytics forecast as of January 1, 2024.
** Please note that these unemployment rates are estimates that have not been adjusted for seasonal variations, and they are derived from Moody’s Analytics forecast as of January 1, 2024.
Houston’s development pace is manageable with the share of existing inventory under construction at 3.7%, which is significantly lower than rates in other Sun Belt markets.
In 2024, the growing demand for cost-effective housing is expected to drive rent growth, particularly benefiting lower tier properties.
Houston’s status as a premier multifamily investment market presents substantial opportunities for investors to reinvigorate transaction activity, with attractively priced deals and abundant institutional capital signaling a likely upswing in investment activity this year.
Houston’s selection as one of the seven regional clean hydrogen hubs in the U.S. by the Department of Energy, and the ensuing $1.2 billion investment in the HyVelocity Hydrogen Hub from the Bipartisan Infrastructure Law, significantly bolsters the local economy, highlighting the region’s expanding prominence in the energy sector.
FORECASTED ABSORPTION
FORECASTED NEW SUPPLY

Houston’s multifamily market demonstrated strong demand throughout 2023, with total annual absorption exceeding 12,000 units, surpassing the pre-COVID five-year average by over 10%. Despite this robust leasing momentum, it couldn’t fully match the pace of nearly 24,000 new units introduced, leading to a slight decrease in occupancy to 91.0% in the final quarter of 2023.
For 2024, unit absorption in Houston is expected to slightly surpass 2023’s performance, with a forecast of 12,539 units. This demand is likely to be driven by the absorption of new inventory, especially in supply-heavy areas like Bear Creek/Copperfield, Neartown/River Oaks, and Sugar Land/Missouri City, which displayed strong absorption figures in 2023. The metro’s 25,000 units currently under construction will continue to challenge the occupancy rate, but it’s not expected to decrease significantly, instead remaining in the vicinity of 91%. Beyond 2024, the Houston multifamily market is poised for a shift due to a decrease in new construction starts, which hit a six-year low in 2023, largely due to high interest rates. This reduction in supply-side pressure is likely to lead to higher occupancy rates and an acceleration in rent growth starting in 2025.
In Houston, despite its leadership in net deliveries, the development pace is relatively restrained, with only 3.7% of its inventory currently underway, below the national average of 5.0%. This is contrasted by other rapidly growing Sun Belt markets like Austin, and Miami, where the percentages of inventory under construction is significantly higher at 14%, and 17%, respectively, posing a greater risk of overbuilding.
In recent years, developers in Houston have redirected their focus, with a noticeable shift towards fast-growing suburban areas in the north and west, contrasting with the previous concentration on urban areas that characterized the post-Great Financial Crisis rebound period. This change in development strategy has been particularly pronounced in suburban areas that boast affluent demographics and lower barriers to entry, such as Northwest Houston, and Bear Creek/Copperfield. These areas are now at the forefront of construction activity, reflecting and supporting the core areas of Houston’s population growth.
Although the current 25,789 units under construction is noteworthy, this figure is below the five-year average of 30,000 units. Moreover, a significant slowdown in construction starts last year suggests a lighter pipeline ahead. In fact, new construction starts in 2023 dropped to their lowest since 2017, indicating a shift in the market dynamics and potentially influencing future supply and demand dynamics.
Average Monthly Mortgage Payment
Average Monthly Rent
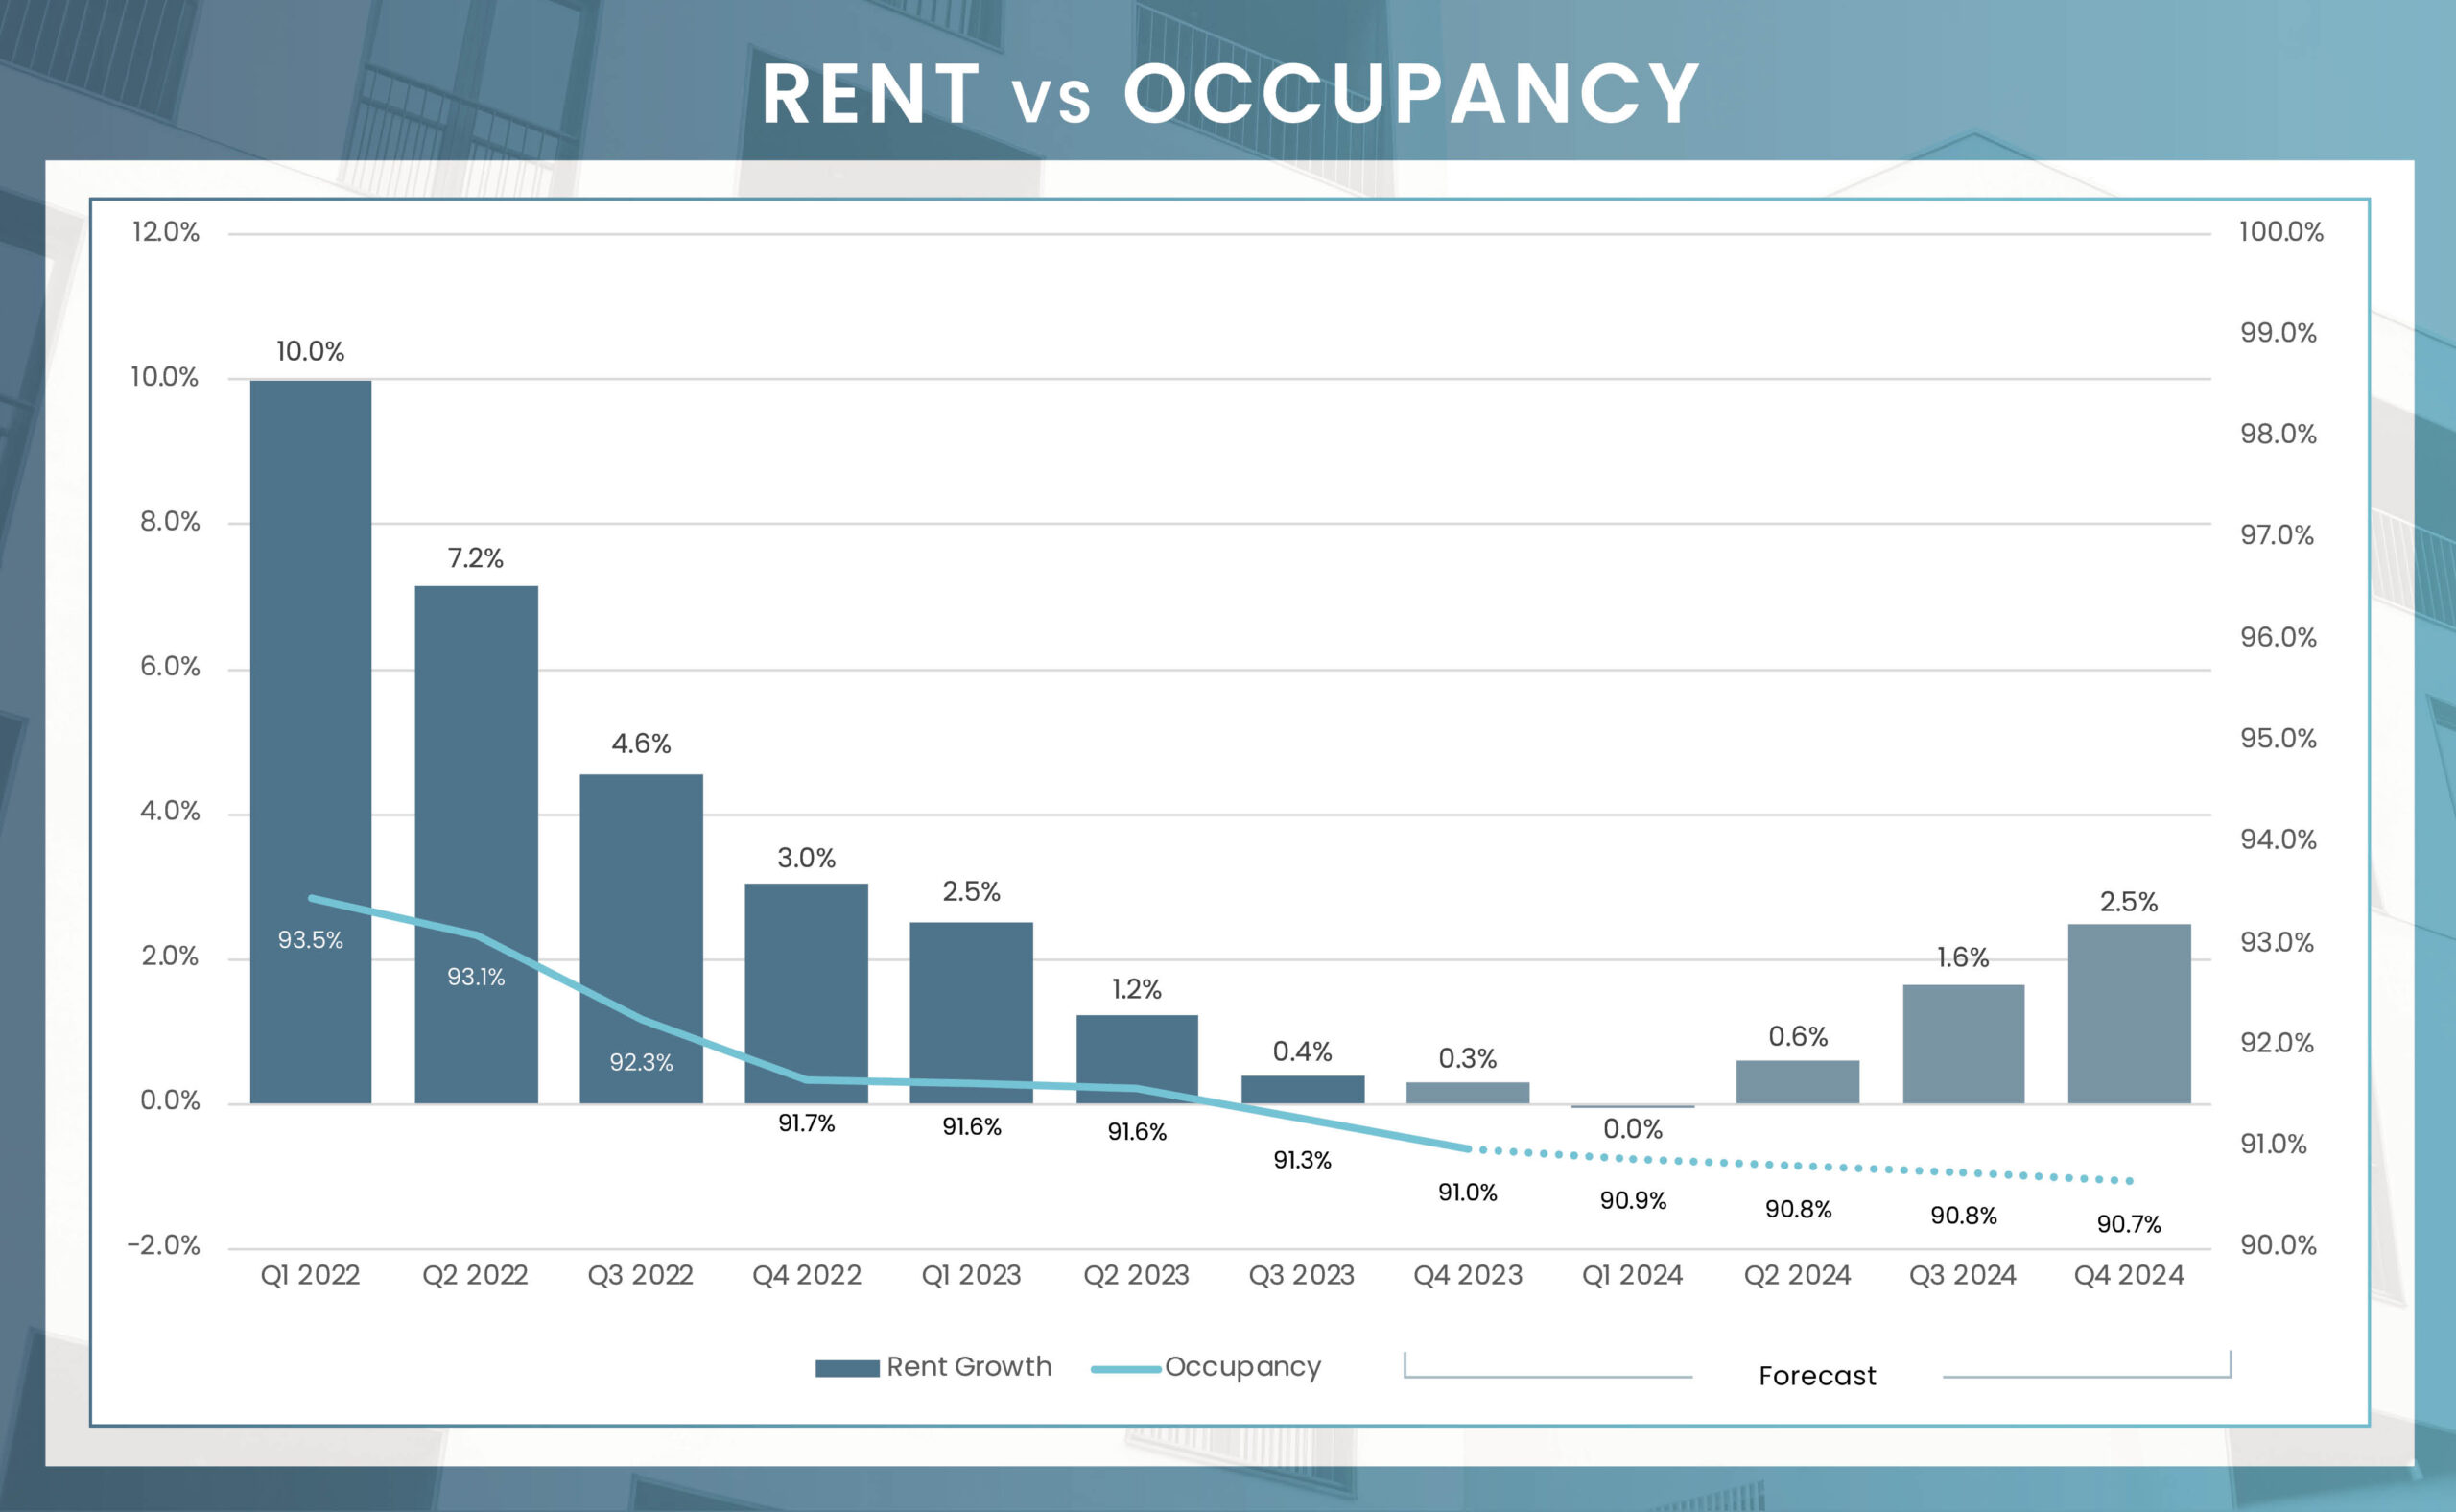
As 2023 ended, Houston’s year-over-year rent growth slowed to 0.3%, the lowest since 2024 and significantly below the 10-year average of 2.6%. This deceleration was particularly noticeable in Downtown and The Heights, which witnessed rent declines on an annual basis in 4Q 2023 due to an influx of new supply.
In the face of this new supply, Class A properties are likely to continue offering attractive concessions to entice renters, potentially suppressing rent increases. Despite this, Class A properties are expected to record decent rent growth performance in 2024. The demand for more cost-effective housing options is also expected to rise, potentially benefiting lower-tier properties. In 2024, Class C properties are predicted to lead in rent growth, followed by Class A, while Class B properties may see comparatively slower growth. This indicates a market bifurcation: Class B renters with financial flexibility might shift to Class A properties, drawn by rent concessions, whereas those under economic strain might opt for more affordable Class C units.
| Submarket | Q4 2023 Stabilized Occupancy | Q4 2024 Stabilized Occupancy (f) | Annual Occupancy Change (2024/2023) | Q4 2023 Average Monthly Rent | Q4 2024 Average Monthly Rent (f) | Annual Rent Change (2024/2023) |
|---|---|---|---|---|---|---|
| Alief | 89.6% | 89.3% | -0.4% | $1,029 | $1,056 | 2.6% |
| Austin County | 93.1% | 93.1% | 0.0% | $1,086 | $1,110 | 2.2% |
| Baytown | 87.4% | 86.9% | -0.5% | $1,034 | $1,058 | 2.3% |
| Bear Creek/Copperfield | 93.1% | 93.0% | -0.1% | $1,440 | $1,472 | 2.2% |
| Briar Forest/West Memorial | 91.4% | 91.1% | -0.3% | $1,311 | $1,342 | 2.4% |
| Brookhollow/Inwood | 92.0% | 91.8% | -0.3% | $1,089 | $1,117 | 2.6% |
| Chambers County | 87.6% | 87.3% | -0.3% | $1,401 | $1,438 | 2.6% |
| Cinco Ranch | 93.2% | 93.0% | -0.2% | $1,555 | $1,589 | 2.2% |
| Downtown Houston | 90.7% | 90.7% | 0.0% | $2,283 | $2,336 | 2.4% |
| East End Houston | 95.2% | 95.0% | -0.2% | $1,258 | $1,290 | 2.6% |
| Galleria/Uptown | 91.1% | 90.8% | -0.3% | $1,491 | $1,531 | 2.7% |
| Greenspoint/IAH Airport | 91.5% | 91.2% | -0.3% | $926 | $952 | 2.8% |
| Heights | 91.9% | 91.6% | -0.2% | $1,625 | $1,666 | 2.5% |
| Lake Houston Area | 91.6% | 91.3% | -0.3% | $1,283 | $1,316 | 2.6% |
| Liberty County | 92.5% | 92.1% | -0.4% | $930 | $953 | 2.4% |
| Medical Center/West University | 91.1% | 90.9% | -0.2% | $1,565 | $1,606 | 2.6% |
| Neartown/River Oaks | 92.4% | 92.2% | -0.2% | $1,902 | $1,952 | 2.6% |
| North Galveston County | 90.5% | 90.2% | -0.3% | $1,369 | $1,399 | 2.2% |
| Northeast Houston | 92.4% | 92.0% | -0.3% | $1,191 | $1,226 | 3.0% |
| Northwest Houston | 90.1% | 89.8% | -0.3% | $1,280 | $1,311 | 2.4% |
| Outlying Montgomery County | 91.4% | 91.1% | -0.3% | $1,275 | $1,304 | 2.2% |
| Pearland | 93.2% | 93.0% | -0.2% | $1,501 | $1,536 | 2.3% |
| Richmond/Rosenberg | 92.7% | 92.4% | -0.3% | $1,372 | $1,401 | 2.1% |
| South Brazoria County | 86.6% | 86.1% | -0.5% | $1,094 | $1,115 | 2.0% |
| South Central Houston | 90.3% | 89.8% | -0.5% | $1,164 | $1,198 | 2.9% |
| South Galveston County | 90.0% | 89.6% | -0.3% | $1,195 | $1,225 | 2.5% |
| Southeast Houston | 87.9% | 87.5% | -0.4% | $1,080 | $1,106 | 2.4% |
| Southeast Montgomery County | 94.0% | 93.9% | -0.2% | $1,434 | $1,470 | 2.5% |
| Southwest Houston | 92.3% | 92.0% | -0.3% | $994 | $1,021 | 2.8% |
| Spring Branch | 90.9% | 90.6% | -0.3% | $1,170 | $1,202 | 2.7% |
| Sugar Land/Missouri City | 94.3% | 94.1% | -0.2% | $1,445 | $1,479 | 2.3% |
| The Woodlands | 93.4% | 93.2% | -0.2% | $1,559 | $1,596 | 2.4% |
| Waller County | 86.9% | 86.3% | -0.6% | $1,111 | $1,137 | 2.3% |
| Westchase/Woodlake | 89.4% | 89.0% | -0.4% | $1,227 | $1,258 | 2.6% |
| Market | 91.0% | 90.7% | -0.3% | $1,301 | $1,333 | 2.5% |
4Q 2023 Unit Inventory
Number of Units Under Construction
Number of Units UC Delivering
In the Next 4 Quarters
| Submarket | Unit Inventory: 4Q 2023 | Units Under Construction | % of Existing Inventory UC | % of Total UC | Units UC Delivering In the Next 4 Quarters |
|---|---|---|---|---|---|
| Alief | 15,551 | 120 | 0.8% | 0.5% | 98 |
| Austin County | 700 | 0 | 0.0% | 0.0% | 0 |
| Baytown | 9,328 | 0 | 0.0% | 0.0% | 0 |
| Bear Creek/Copperfield | 30,840 | 3,365 | 10.9% | 13.0% | 1,232 |
| Briar Forest/West Memorial | 30,279 | 0 | 0.0% | 0.0% | 0 |
| Brookhollow/Inwood | 24,811 | 665 | 2.7% | 2.6% | 630 |
| Chambers County | 968 | 0 | 0.0% | 0.0% | 0 |
| Cinco Ranch | 19,509 | 782 | 4.0% | 3.0% | 468 |
| Downtown Houston | 6,716 | 301 | 4.5% | 1.2% | 291 |
| East End Houston | 4,638 | 1,769 | 38.1% | 6.9% | 1,173 |
| Galleria/Uptown | 24,118 | 0 | 0.0% | 0.0% | 0 |
| Greenspoint/IAH Airport | 21,230 | 0 | 0.0% | 0.0% | -29 |
| Heights | 11,975 | 1,346 | 11.2% | 5.2% | 760 |
| Lake Houston Area | 25,297 | 780 | 3.1% | 3.0% | 424 |
| Liberty County | 1,001 | 200 | 20.0% | 0.8% | 198 |
| Medical Center/West University | 27,730 | 475 | 1.7% | 1.8% | 436 |
| Neartown/River Oaks | 47,663 | 1,711 | 3.6% | 6.6% | 665 |
| North Galveston County | 10,152 | 538 | 5.3% | 2.1% | 410 |
| Northeast Houston | 3,438 | 0 | 0.0% | 0.0% | 0 |
| Northwest Houston | 71,662 | 2,468 | 3.4% | 9.6% | 291 |
| Outlying Montgomery County | 12,269 | 1,357 | 11.1% | 5.3% | 388 |
| Pearland | 8,752 | 0 | 0.0% | 0.0% | -12 |
| Richmond/Rosenberg | 8,711 | 1,569 | 18.0% | 6.1% | 432 |
| South Brazoria County | 12,563 | 362 | 2.9% | 1.4% | 344 |
| South Central Houston | 5,206 | 0 | 0.0% | 0.0% | 0 |
| South Galveston County | 13,181 | 320 | 2.4% | 1.2% | 301 |
| Southeast Houston | 75,356 | 1,104 | 1.5% | 4.3% | 847 |
| Southeast Montgomery County | 5,572 | 883 | 15.8% | 3.4% | 873 |
| Southwest Houston | 69,430 | 1,372 | 2.0% | 5.3% | 640 |
| Spring Branch | 22,246 | 568 | 2.6% | 2.2% | 277 |
| Sugar Land/Missouri City | 19,524 | 1,977 | 10.1% | 7.7% | 1,432 |
| The Woodlands | 16,561 | 1,413 | 8.5% | 5.5% | 450 |
| Waller County | 1,464 | 0 | 0.0% | 0.0% | 0 |
| Westchase/Woodlake | 41,566 | 344 | 0.8% | 1.3% | 288 |
| Market | 700,007 | 25,789 | 3.7% | 100% | 13,307 |
Preliminary data from MSCI indicates that the sales volume for conventional multifamily assets concluded 2023 on a subdued note. Although it is common for sales to be recorded up to the final days of the year and for data services to take several weeks to consolidate these transactions, it is improbable that the expected uptick in volume will significantly alter the overall trend. The final quarter of 2023 saw sales volume of $549.2 million, marking the lowest fourth quarter total in over a decade. In turn, annual transaction volume amounted to $2.21 billion over 61 sales, a 69% decrease from the previous year and only higher than 2024’s $1.88 billion in the past decade.
The traded assets skewed towards Class B and C properties, as evidenced by the decreased price per unit (PPU) compared to 2022. This trend aligns with the current cautious stance of institutional capital, which remains largely on the sidelines. However, looking forward to 2024, if interest rates stabilize or decrease, Houston’s continued appeal as a prime multifamily investment market could offer significant opportunities for inventors jump starting transaction activity. The potential for attractively priced deals, combined with the considerable institutional capital currently inactive, suggests a resurgence in investment activity is likely this year.
*Most Active Buyers and Sellers are based on the sale volume of apartment units.
* Trailing 4Q average PPU
* Preliminary Data from RCA – Individual transaction $2.5M +
P=Preliminary

| Sector | Employment Change 2023 to 2024 | Percent Change |
|---|---|---|
| Overall Employment | 75,000 | 2.2% |
| Manufacturing | 6,100 | 2.6% |
| Construction | 0 | 0.0% |
| Trade, Transport., & Utilities | 19,300 | 2.8% |
| Information | 800 | 2.4% |
| Financial Activities | 4,100 | 2.2% |
| Professional & Business Services | 7,000 | 1.3% |
| Education & Health Services | 14,900 | 3.3% |
| Government | 6,500 | 1.5% |
| Lesuire & Hospitality | 10,300 | 3.0% |
| Natural Resources & Mining | 5,100 | 7.3% |
| Other Services | 1,000 | 0.8% |
Houston’s economy, having surged post-pandemic, is set for a phase of moderation in 2024, though it remains resilient and healthy. The region is on track to add75,000 jobs in 2024, which, while lower than recent years, still represents a robust increase. A significant boost to the local economy came in October when Houston was chosen as one of seven regional clean hydrogen hubs in the U.S. by the Department of Energy. The HyVelocity Hydrogen Hub, with a consortium of seven industry giants, is slated to receive up to $1.2 billion from the Bipartisan Infrastructure Law funding, underscoring the region’s growing energy sector prominence.
The energy industry, a cornerstone of Houston’s economy, is expected to see modest growth in 2024. The U.S. Energy Information Administration forecasts WTI, to average $91 per barrel. This is projected to result in a slight increase in exploration activities and a consequent modest rise in employment in the sector, adding about 5,000 jobs by year-end. Healthcare continues to be Houston’s most resilient industry, driven by factors such as population and job growth, extended life expectancy, and an increase in the number of insured individuals.
In 2024, Houston’s economic growth is expected to slow down, appearing sluggish only in comparison to the exceptional growth of the past three years. This period of adjustment is akin to a distance runner finding a sustainable pace after a sprint. By 2025, growth is likely to resume at a more moderate, sustainable rate, aligning with the region’s long-term economic trajectory.