Denver 2Q23
Multifamily Market Report
$1,898
average rent
94.1%
average occupancy rate
$723.6M
ytd sales volume
1.7%
YoY rent change
-2.1 POINTS
yoy occupancy change
32
ytd individual transactions
Supply & Demand
2Q23
2,361 Units
QUARTERLY DEMAND
YTD: 3,771
2,497 Units
QUARTERLY COMPLETIONS
YTD: 5,001
Annual Demand vs Completions
Demand Trends
In the second quarter of 2023, Denver reported a net gain of 2,361 units in terms of apartment absorption. This number, while still lagging behind the average second-quarter absorption of roughly 3,200 units over the ten-year period ending in 2021, nevertheless marks a significant improvement from the nearly stagnant absorption rate of 69 units recorded in the same quarter of 2022.
Among Denver’s 19 submarkets, 13 reported modest quarterly absorption, while the remaining six witnessed minor net move-outs.
Completion Trends
Denver continues to see a surge in new supply, with 2,497 units entering the market in the second quarter. This addition pushes the rolling four-quarter total to 8,834 units, edging slightly above the market’s five-year average.
Over the past year, the wave of completions has expanded the local inventory base by 2.8%. The highest influx of supply was observed in Northeast Denver and South Denver/Englewood.
Demand Outlook
The market’s ability to absorb the high levels of incoming supply will be a critical factor in the future.
Although Denver’s performance is anticipated to continue lagging behind the U.S. average, we expect that demand trends, economic growth, and favorable migration patterns will underpin strong market fundamentals moving forward.
New Supply Outlook
By the close of Q2 2023, a total of 29,975 units were under construction, with a significant majority – 19,806 units – slated for completion in the upcoming four quarters.
The upcoming year’s scheduled deliveries are anticipated to primarily be located in Northeast Denver, Downtown / Highlands / Lincoln Park, and Five Points / Capitol Hill / Cherry Creek submarkets.
Occupancy & Rent Trends
Occupancy trends
In the most recent quarter, the market wide occupancy in Denver remained steady at 94.1%, reflecting a consistency in demand. However, when compared year-over-year, there was a decrease of 2.1 percentage points, indicating some softening in the market compared to the same period in the previous year. A closer look at Denver’s asset classes reveals a tightly clustered occupancy pattern. Class A units registered at 93.7%, Class B at 94.4%, and Class C at 93.8%, highlighting a balanced demand across different property grades. Submarket occupancy ranged from a low of 92.7% in North Aurora and Thornton/Northglenn to a high of 95.0% in Parker/Castle Rock and South Lakewood.
RENTAL TRENDS
In Q2 2023, new lease rents in the Denver-Aurora-Lakewood market saw a year-over-year increase of 1.7%, with the average rental rate landing at $1,898 per month. Despite this growth, the performance fell short of the market’s five-year average increase of 4.8%. Analyzing the performance by product class, Class A units led with an annual effective rent growth of 2.9%, followed by Class B units at 1.7%, and Class C units with a modest rise of 0.7%. In terms of submarkets, Arvada / Golden, Westminster, and South Denver / Englewood emerged as the strongest performers with annual rent changes of 3.5%, 3.4%, and 3.4% respectively, over the past year. Conversely, the Thornton / Northglenn submarket underperformed with a rent decrease of 0.7%. As we look towards the next four quarters, we project that average rent growth in the Denver market will float around the current rate.
Submarket Rent & Occupancy
Submarket | Average Occupancy | Annual Occupancy Change | Average Monthly Rent | Annual Rent Change |
---|---|---|---|---|
Downtown/Highlands/Lincoln Park | 93.4% | -1.9% | $2,293 | 2.1% |
Five Points/Capitol Hill/Cherry Creek | 93.9% | -1.7% | $2,113 | 1.4% |
South Denver/Englewood | 94.6% | -1.8% | $1,928 | 3.4% |
South Lakewood | 95.0% | -1.4% | $1,837 | 1.6% |
North Lakewood/Wheat Ridge | 94.3% | -2.9% | $1,782 | 0.8% |
Arvada/Golden | 94.7% | -2.4% | $1,945 | 3.5% |
Westminster | 93.6% | -2.2% | $1,738 | 3.4% |
Broomfield | 94.6% | -1.7% | $1,957 | 1.1% |
Thornton/Northglenn | 92.7% | -3.6% | $1,756 | -0.7% |
Northeast Denver | 94.2% | -1.8% | $1,927 | 1.3% |
Glendale | 93.8% | -2.1% | $1,620 | 1.0% |
Southeast Denver | 93.7% | -2.8% | $1,675 | 0.0% |
North Aurora | 92.7% | -4.0% | $1,595 | 2.2% |
Southwest Aurora | 94.3% | -2.0% | $1,628 | 3.2% |
Southeast Aurora/East Arapahoe County | 94.4% | -1.3% | $1,858 | 0.4% |
Tech Center | 94.5% | -1.9% | $2,003 | 1.5% |
Littleton | 94.7% | -1.6% | $1,974 | 2.3% |
Highlands Ranch | 94.9% | -1.5% | $2,160 | 3.1% |
Parker/Castle Rock | 95.0% | -1.2% | $1,959 | 2.3% |
Units by Submarket Delivering in 2023
29,975
Units Under Construction
19,806
Units UC Delivering In the Next 4 Quarters
Percentage of Units Under Construction
Percentage of Units Delivering Next 4Q
Sales Activity
During the first half of 2023, the Denver market saw transaction volumes for conventional multifamily properties amounting to approximately $723.9 million. This represented a significant decrease of about 65% year-over-year. Concurrently, the number of transactions also dropped, falling by about 53% over the past year, with only 32 apartment properties changing hands.
- Sequoia Equities
- Griffis Residential
- MG Properties
- SARES-REGIS Group
- Ladera Capital Partners
- Evergreen Dev Co
- GTIS Partners
- McWhinney Enterprises
- National Development
- Brookfield AM
TRANSACTION VOLUME
YTD Transaction Volume
Y-O-Y Change
Individual Transaction Count
Price Per Unit
Annual Price Change
* Trailing 4Q average PPU
* Preliminary Data from RCA – Individual conventional MF transaction $2.5M +
Economy
In May 2023, the Denver metro area’s job landscape presented a complex picture. The total nonfarm employment saw a slight dip of 0.1%, shedding 2,300 jobs compared to the same month in 2022, bringing the total to 1,596,000. Despite this slight decrease in total jobs, several sectors demonstrated growth. The government sector experienced the most substantial job gains with an addition of 10,500 positions, representing a solid 5.1% expansion. The manufacturing sector saw a healthy increase of 1.3%, which equated to an additional 900 jobs. Meanwhile, the leisure and hospitality sector, a sector vital for Denver’s economy, observed a 1.4% growth, equivalent to an addition of 2,400 jobs.
-2.3K
May Annual Jobs Created
-0.1%
May 23 Employment growth
2.8%
May 23 Unemployment rate
3.4% us may rate
Top 5 Employment Sector Annual Change
Government
Professional & Business Services
Change from May 2022 to May 2023:
10,500
Percent Change:
5.1%
Other Services
Professional & Business Services
Change from May 2022 to May 2023:
3,900
Percent Change:
5.8%
Leisure & Hospitality
Professional & Business Services
Change from May 2022 to May 2023:
2,400
Percent Change:
1.4%
Professional & Business Services
Change from May 2022 to May 2023:
1,400
Percent Change:
0.4%
Manufacturing
Manufacturing
Change from May 2022 to May 2023:
900
Percent Change:
1.3%
Hover over icons to view data
Tap icons to view data
Sector | Change from May 2022 to May 2023 | Percent Change |
---|---|---|
Government | 10,500 | 5.10% |
Other services | 3,900 | 5.80% |
Leisure and hospitality | 2,400 | 1.40% |
Professional and business services | 1,400 | 0.40% |
Manufacturing | 900 | 1.30% |
Mining, logging, and construction | -100 | -0.10% |
Information | -2,900 | -5.30% |
Education and health services | -3,300 | -1.70% |
Trade, transportation, and utilities | -5,100 | -1.80% |
Financial activities | -10,000 | -8.4 |
Major Economic Developments

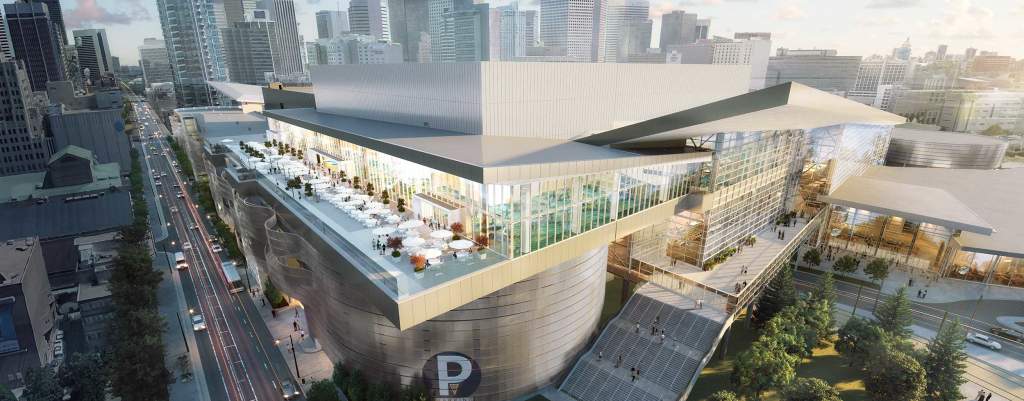
Colorado Convention Center Expansion
$4B Added to GRP Annually
2,690 Jobs Created
Downtown Denver Location
End of 2023 Expected Completion

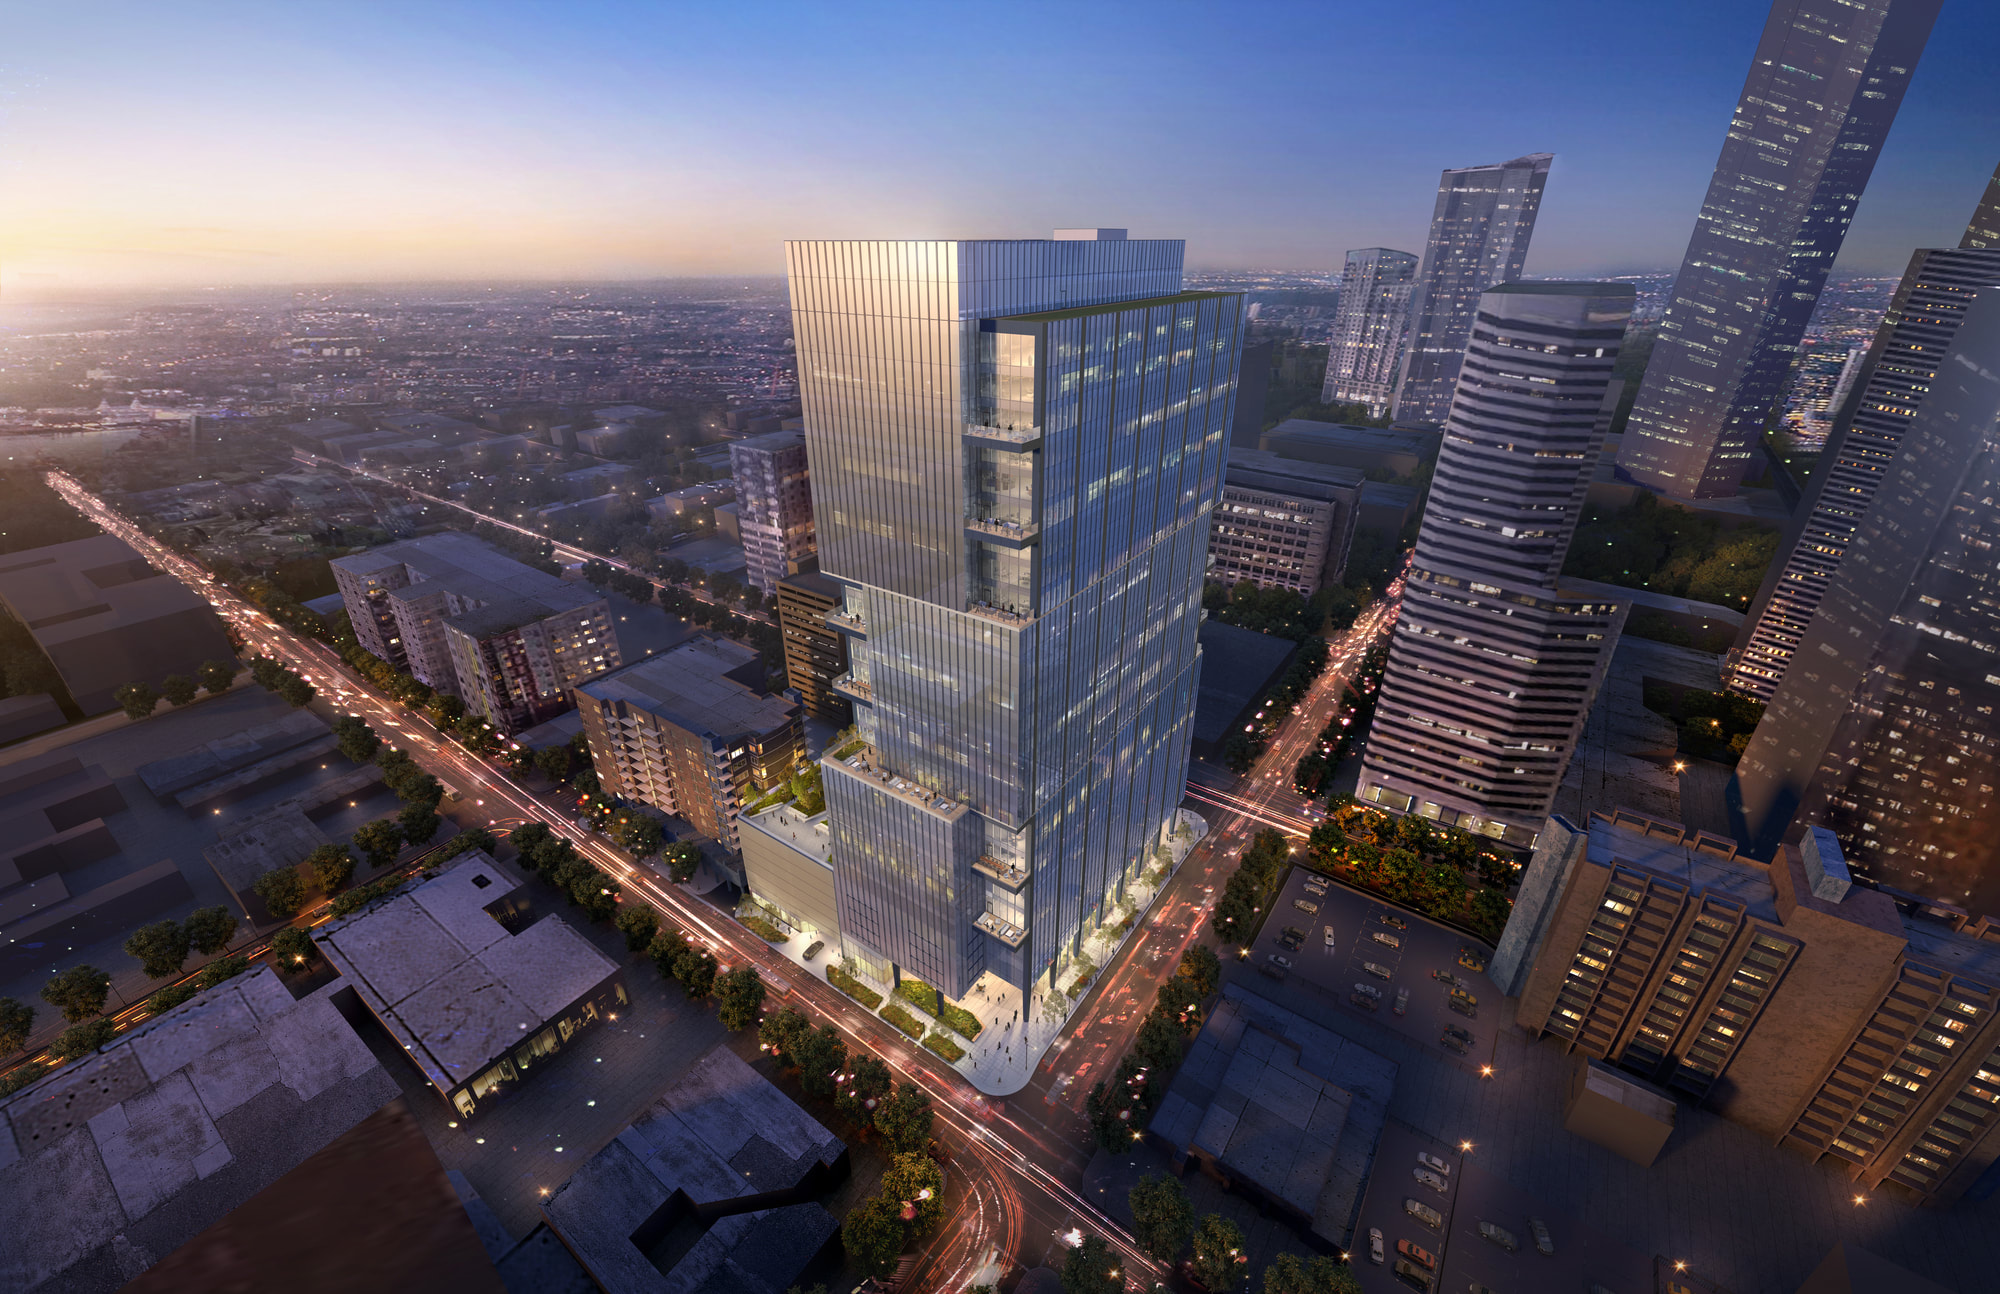
1900 Lawrence
Office Building
30-Story Class A office skyscraper
$400M Investment Cost
Downtown Denver Location
Fall 2023 Expected Completion

Colorado Statewide
Road Projects
$1.6B Overall Government Investment
5,000+ Jobs created Over 10 Years
Scope No increased taxes for
Jackson County residents
2028 Expected Completion
Market Outlook
The first half of 2023 witnessed a rebound in demand, reinforcing stability within the Denver apartment market. A key factor that will guide the market’s future course is the absorption of a substantial influx of new supply. Denver’s housing inventory is projected to grow by an estimated 19,800 units, or about 6%, by the end of the 2nd quarter 2024. This notable expansion would establish a new high-water mark for housing inventory in the market. Although Denver’s performance might continue to trail the U.S. average in the short term, prevailing market indicators suggest an optimistic outlook. The combination of robust demand trends, vigorous economic growth, and positive in-migration patterns underscore the region’s resilient market fundamentals. These elements suggest that Denver’s apartment market will continue to exhibit resilience and potential for growth in the forthcoming period.
Sources: RealPage; BLS; MSCI; Denver Business Journal; Denver Economic Development Corp.
To Gain Further Insights Into The Denver Market Please Reach Out To Our local Team