MARKET SNAPSHOT
$1,531 3Q 2024
91.7% 3Q 2024
8,791 [YTD: 23,173]
-1.5% 3Q 2024
-60 BASIS POINTS
8,994 [YTD: 30,786]
While the overall market saw a 1.5% rent decline, bringing rates to $1,531, submarkets like Hood County posted growth of 4.5%. In contrast, high-supply areas like Frisco/Prosper experienced a 4.2% rent drop.
The pace of new unit deliveries is slowing, from 11,740 last quarter to 9,000 this quarter, and 6,970 expected next. This easing supply should help stabilize occupancy and rents, with projected rent growth of 2.4% by mid-2025.
DFW is better positioned than Austin and Phoenix to handle supply pressures due to competitive costs, strategic location, population growth, and the expansion of its finance sector, with projects like Wells Fargo’s $500 million campus and Goldman Sachs’ new headquarters.
8,791 UNITS
[YTD: 23,173]
The Dallas-Fort Worth multifamily market delivered a strong performance in Q3 2024, with leasing activity gaining momentum during the summer. A total of 8,791 units were absorbed, closely matching the 8,994 units delivered in the same period. While the year-to-date supply-demand imbalance persists, the narrowing gap this quarter should reassure property owners and operators that the significant disparity between new supply and weaker absorption is largely behind them. New starts are trending back toward their pre-pandemic average of 19,000 units annually. Nearly all of North Texas’ 41 submarkets posted net positive absorption both in the quarter and over the past year, with Allen/McKinney and Frisco/Prosper leading the way, contributing 11.7% and 10.2% of the total units absorbed, respectively.
8,994 UNITS
[YTD: 30,786]
Multifamily construction activity in Dallas-Fort Worth has slowed as weaker property performance and rising financing costs discourage developers from breaking ground on new projects. Currently, 43,000 units are under construction, a notable decline from the peak of 64,000 units. In the most recent quarter, the region delivered 8,994 new apartment units, with most concentrated in 19 of the Metroplex’s 41 submarkets. Over the past year, Allen/McKinney and Frisco/Prosper have been key development hubs, with more than 4,600 and 4,300 units delivered, respectively. In the third quarter, East Dallas saw significant activity, with nearly 900 units delivered, second only to Allen/McKinney’s 1,290 units. Current construction levels in Dallas-Fort Worth account for 4.9% of existing inventory, exceeding the U.S. average of 3.5%, but falling short of other Sun Belt markets like Phoenix, where around 8% of inventory is under construction.
The influx of new rental units has caused a noticeable dip in occupancy rates across the Dallas-Fort Worth metroplex, with a year-over-year decline of 60 basis points, bringing overall occupancy to 91.7%. However, this trend varies significantly across submarkets. Occupancy rates range from a low of 84.0% in East Fort Worth to a high of 94.4% in Hood County. Notably, eleven submarkets experienced annual occupancy improvements. Rockwall/Wylie recorded the largest gain, with a 200-basis point increase, while Southeast Dallas followed with a 130-basis point improvement over the past year.
Demand in submarkets with higher concentrations of mid-tier units increased in 2024. For instance, Irving, Arlington, Mesquite, and Garland/Mesquite are experiencing rebounding demand after underperforming over the past two years. occupancies in mid-tier properties remain slightly below the market average at 90.7%.
Amid strong demand in the second and third quarters of 2024, the Dallas-Fort Worth multifamily market is gradually stabilizing. Average effective rents saw a modest decline of 1.5% year-over-year by the end of Q3 2024, bringing the average rate to $1,531. However, taking a broader view, rents have increased by more than 20% over the past five years, averaging an annual rise of approximately 4.3% since 2019. Submarkets with limited inventory growth, such as Hood County, reported notable annual rent increases of up to 4.5%, while more active areas like Frisco/Prosper experienced declines of up to 4.2%.
Looking ahead to 2025, the outlook is positive. The pace of new unit completions will continue to slow, as only 6,970 units are scheduled for completion in the final quarter of the year. This deceleration in construction activity is expected to ease pressure on owners and operators, supporting the stabilization of rents and occupancy. Our forecasts project a return to positive rent growth by mid-2025, with annual growth accelerating to 2.4% by year-end 2025.
The Dallas-Fort Worth metroplex continued its robust economic growth in August 2024, with the Bureau of Labor Statistics (BLS) reporting the addition of 59,300 jobs, representing a 1.4% increase in employment from the previous year. Education and Health Services sector and the Financial Activities were the main driver of job additions, responsible for 14,600 jobs, and 10,700 jobs accordingly, both expending 2.9% year-over-year. On the sector expansion front, the Mining, Logging, and Construction industry lead with a 4.1% year-over-year change adding 10,200 jobs since the previous year. DFW’s unemployment rate held steady at 4.1%, remaining below 10 points the national average of 4.2%.
August 2024 ANNUAL JOBS CREATED
AUGUST 2024 EMPLOYMENT GROWTH
AUGUST 2024 Unemployment rate
4.2% us August rate
Nominal Change
from August 2023
to August 2024: 14,600
Percent Change: 2.9%
Nominal Change
from August 2023
to August 2024: 10,700
Percent Change: 2.9%
Nominal Change
from August 2023
to August 2024: 10,200
Percent Change: 4.1%
Nominal Change
from August 2023
to August 2024: 9,000
Percent Change: 1.0%
Nominal Change
from August 2023
to August 2024: 8,700
Percent Change: 2.8%
| Sector | Nominal Change from August 2023 to August 2024 | Percent Change |
|---|---|---|
| Education and Health Services | 14,600 | 2.9% |
| Financial Activities | 10,700 | 2.9% |
| Mining, Logging, and Construction | 10,200 | 4.1% |
| Trade, Transportation, and Utilities | 9,000 | 1.0% |
| Manufacturing | 8,700 | 2.8% |
| Other Services | 5,700 | 4.1% |
| Leisure and Hospitality | 5,200 | 1.2% |
| Government | 5,100 | 1.1% |
| Information | 0 | 0.0% |
| Professional and Business Services | -10,200 | -1.3% |

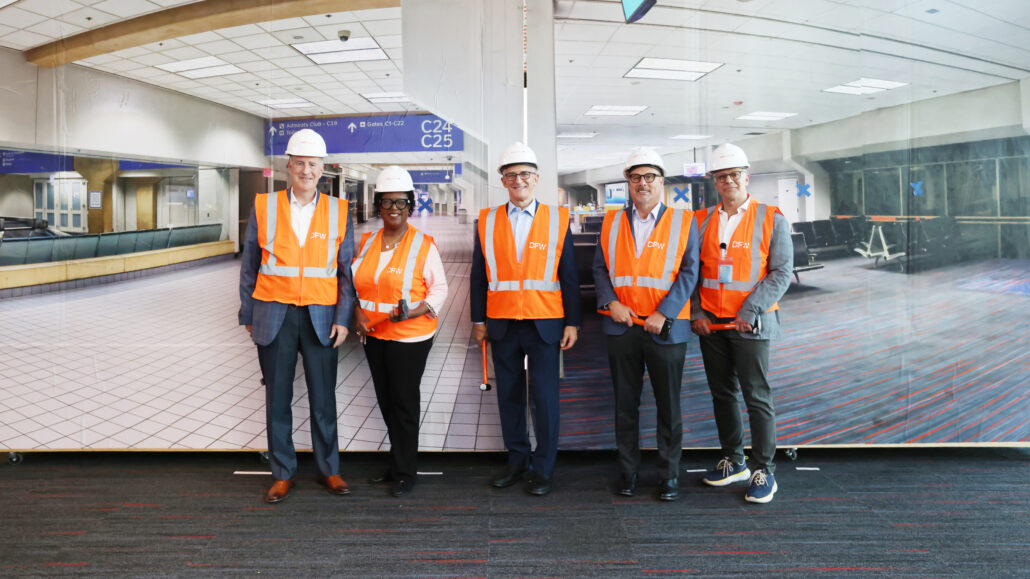
Dallas Fort Worth International Airport is currently undergoing its largest capital investment project since opening in 1974.

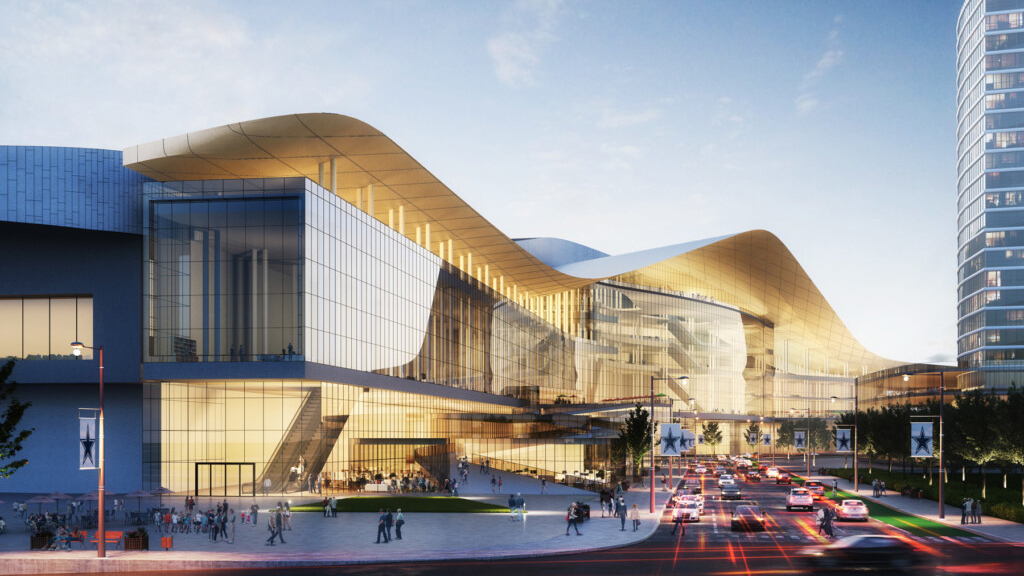
The Hutchison Convention Center expansion has already secured an estimated $1 billion in economic impact from booked business starting in Q1 2029.

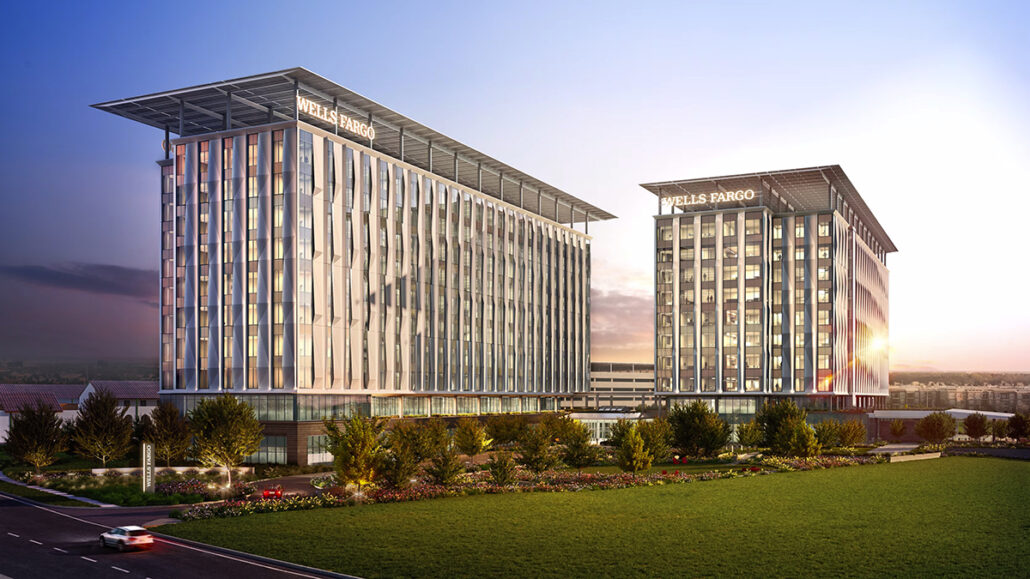
Wells Fargo is constructing a two-tower, 22-acre campus in Irving, TX, one of the biggest current projects in North Texas, set to open in 2025.
While many peer markets face significant supply-side pressures, Dallas-Fort Worth (DFW) is well-positioned for a quicker recovery compared to cities like Austin and Phoenix, where excessive development has slowed rent growth. DFW’s competitive costs, strategic location, and continued population growth keep it primed for sustained residential and commercial demand. Fort Worth, in particular, is experiencing transformative developments with major economic impacts, including the $9 billion modernization of DFW International Airport and a $6 billion upgrade to the Dallas Convention Center. Additionally, Wells Fargo’s $500 million campus, poised to be the state’s largest office project, and Goldman Sachs’ upcoming regional headquarters further solidify the Metroplex’s growing reputation as a global finance hub.
As 2024 concludes, increasing demand and a slowdown in new construction are expected to stabilize occupancy rates and support rent growth. Projections indicate a 2.4% rent growth rebound by mid-2025, reflecting DFW’s resilience and strength in the face of market pressures.
Sources: Costar; ESRI; U.S. Census Bureau; Yardi Matrix; U.S. Bureau of Labor Statistics


