$1,492 4Q 2023
$1,535 4Q 2024
2.9%
91.9% 4Q 2023
91.6% 4Q 2024
-30 BASIS POINTS
4.27M 2023
4.35M 2024
3.8% 2023
3.9% 2024
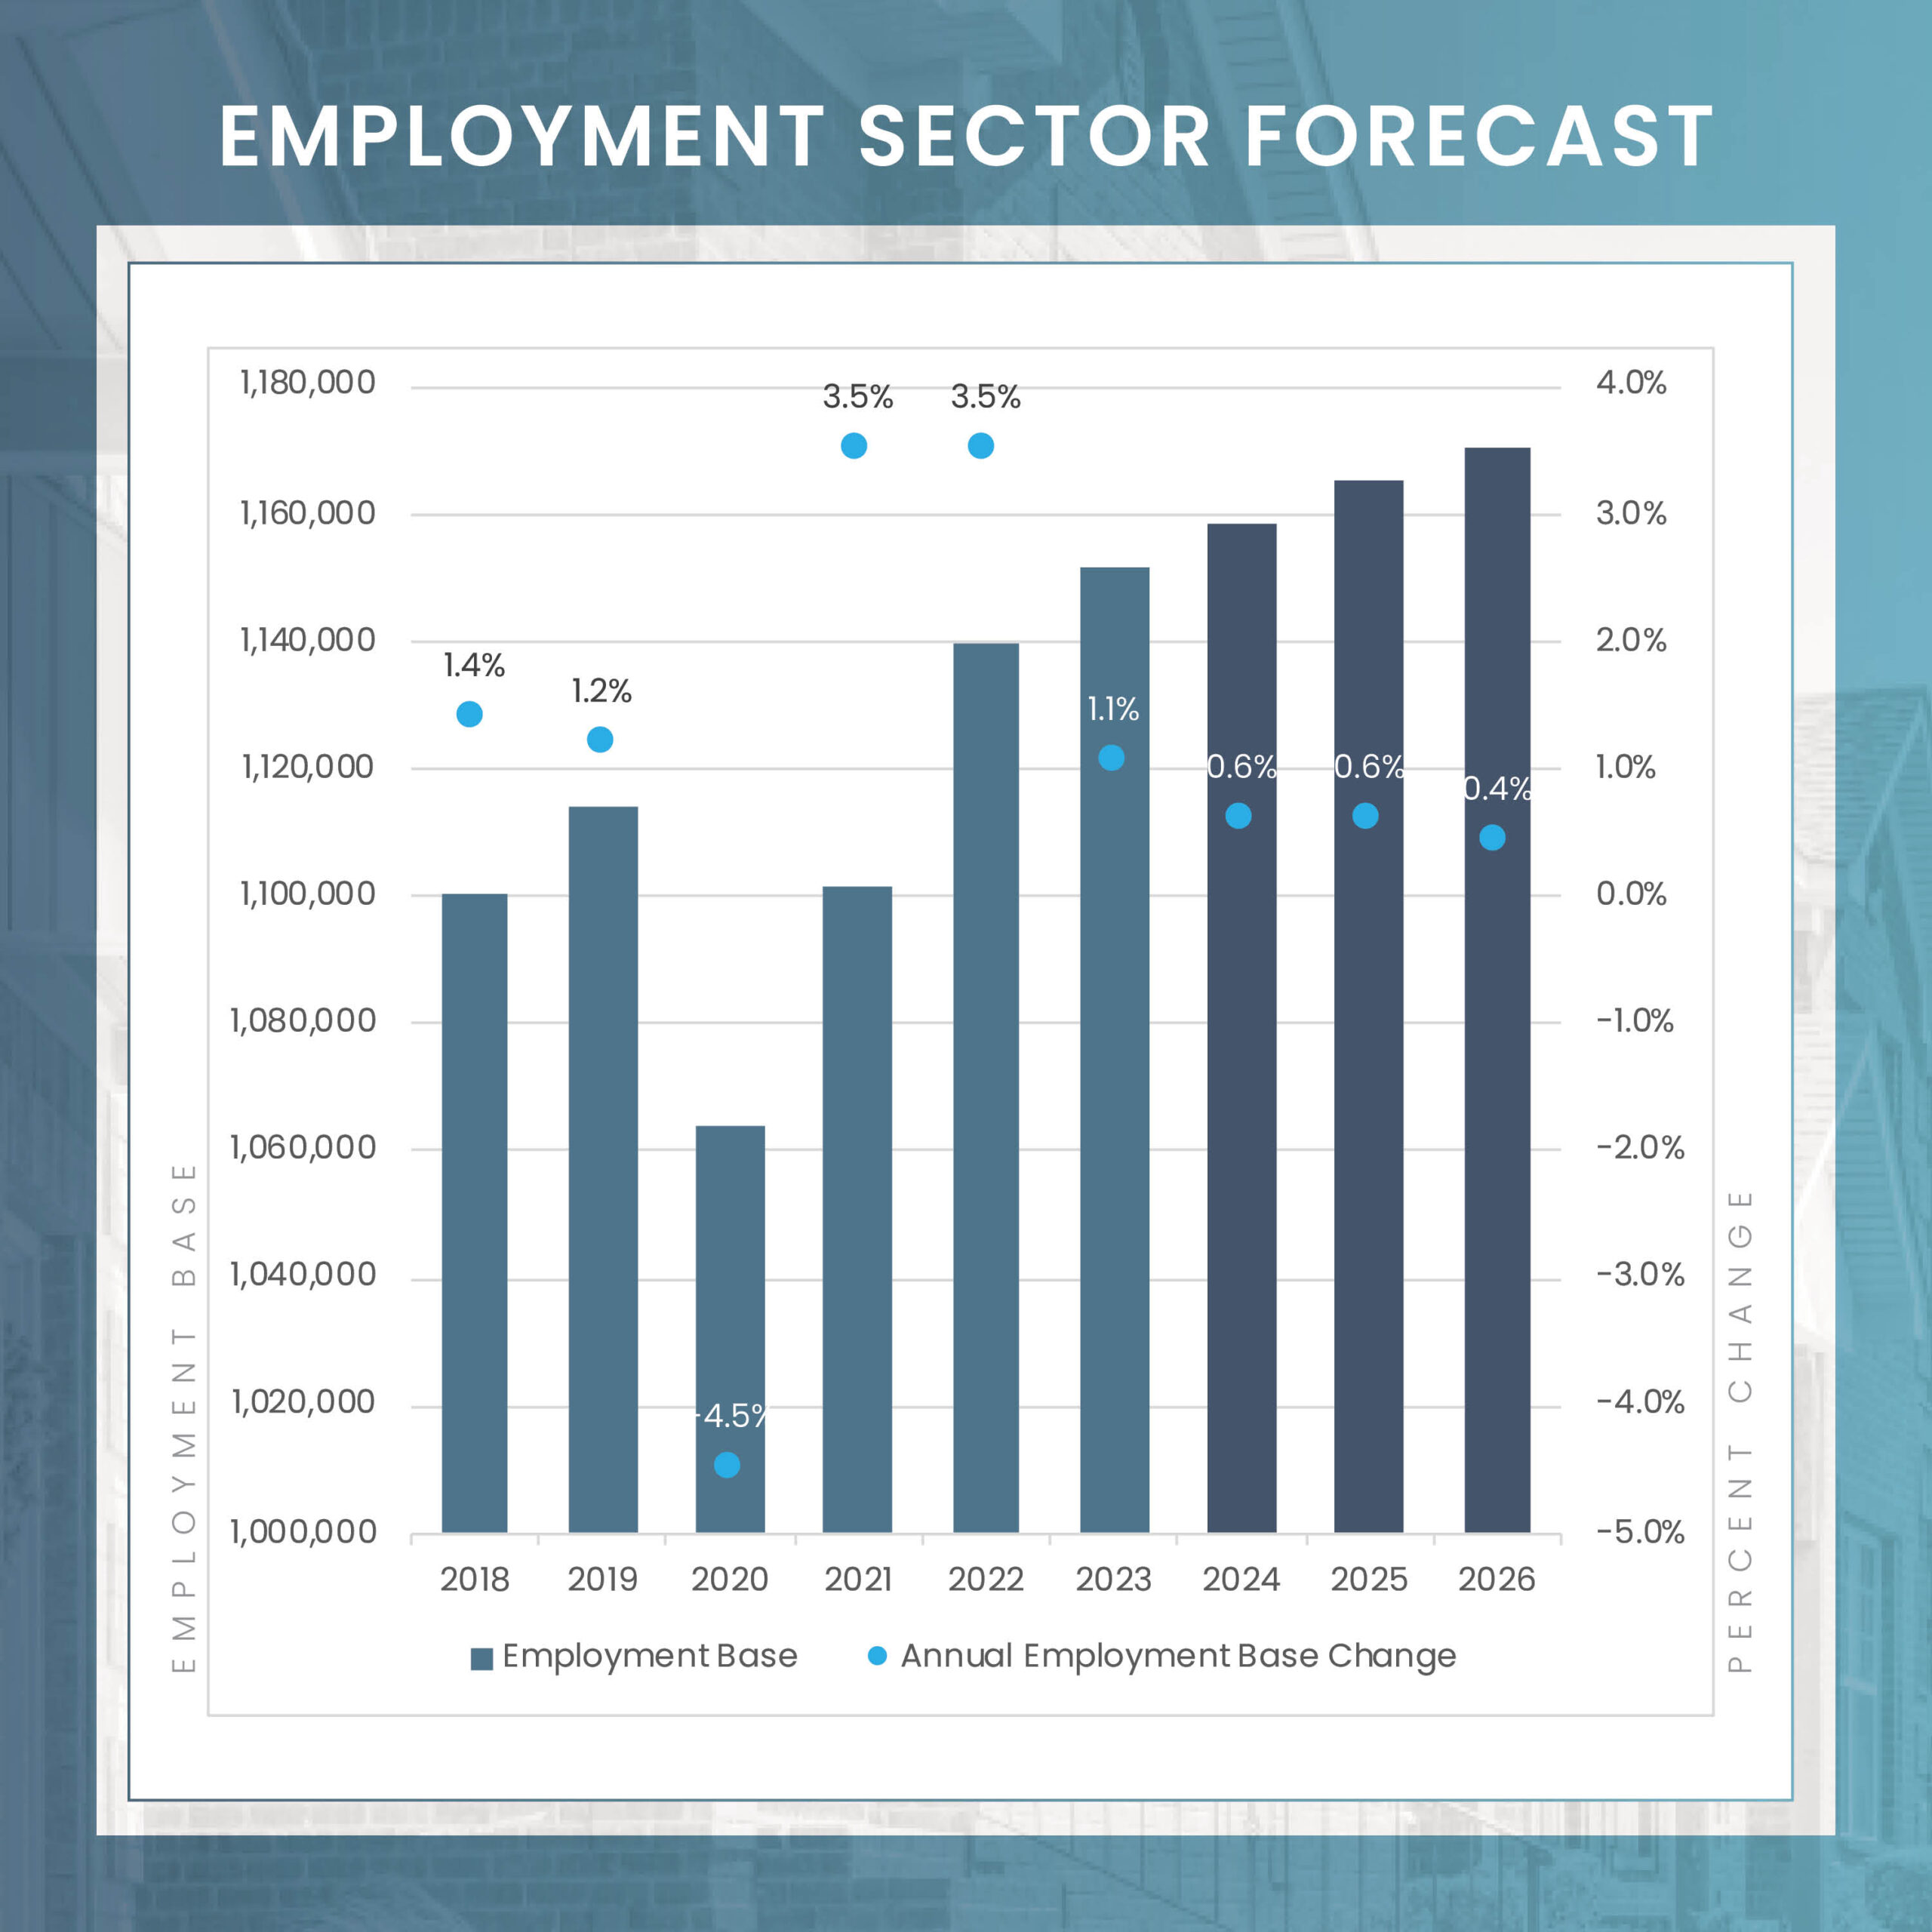
* Please note that these employment figures have been adjusted for seasonal variations and are based on Moody’s Analytics forecast as of January 1, 2024.
** Please note that these unemployment rates are estimates that have not been adjusted for seasonal variations, and they are derived from Moody’s Analytics forecast as of January 1, 2024.
FORECASTED ABSORPTION
FORECASTED NEW SUPPLY

The Dallas-Fort Worth multifamily housing market is experiencing a resurgence in demand, bouncing back from a lackluster performance in net absorption in 2022. In 2023, the region recorded a notable increase in net absorption, reaching approximately 12,500 units, a significant rise from the 3,000 units absorbed in the previous year. Looking ahead to 2024, the fundamental, long-term drivers that have historically buoyed the Dallas-Fort Worth market, even amid periods of uncertainty, are expected to catalyze demand. This surge is projected to propel absorption rates to over 25,000 units in 2024, returning to the typical annual absorption levels seen between 2017 and 2024.
Despite this positive trend, the Metroplex is preparing to navigate another year of high unit deliveries, which is expected to slightly surpass the rejuvenated demand. However, the discrepancy between supply and demand is predicted to be moderate to minimal, resulting in only a modest increase in vacancy rates for the year. This scenario suggests a gradually stabilizing market, adapting to both the influx of new units and the recovering demand for multifamily housing.
Dallas Fort Worth is currently the leading market in the U.S. for apartment construction, with a staggering 60,000 units in development. This volume will expand the apartment inventory by 7%. Dallas has consistently been a leading market of apartment construction activity, building over 130,000 units in the last five years – the highest in the U.S. during this period. Of the 60,000 units currently underway in the Metroplex, just over half are expected to be completed in 2023. The northern suburbs, home to the area’s strongest demographic and economic growth, are set to receive the bulk of these new units. The Frisco/Prosper submarket contains nearly 13% of the Metroplex’s construction activity, amounting to 7,742 units, and is anticipated to add approximately 3,500 of those units in 2024. Further north, the Allen/McKinney submarket, containing 9% of the total units under construction with 5,448 units, ranks as the second-largest home of construction activity and is on track to introduce an additional 1,500 units in 2024.
Despite the high volume of ongoing projects, a medium to long-term perspective indicates a slowdown in new construction starts and permits, largely due to escalating financing and construction costs. Starts decreased from about 42,000 in 2022 to 27,000 in 2023, aligning more closely with the pre-pandemic annual average total. Once the current wave of new units is absorbed, vacancies are expected to return to their long-term average, and rent growth should stabilize at its typical rate. This scenario suggests a gradual return to equilibrium in the Dallas Fort Worth apartment market following a period of intense development activity.
Average Monthly Mortgage Payment
Average Monthly Rent

As we enter the new year, 2024 is expected to witness a rebound in rent growth. Although the typically slower leasing period of the first quarter may initially impact rent growth negatively, the situation is forecasted to improve by mid-year. This optimism is rooted in the historically observed increase in leasing traffic during the spring and summer months, which generally supports rent growth. Consequently, operators in the Dallas-Fort Worth area are likely to see more favorable conditions for rent increases as the year unfolds. By the end of 2024, rent increases across the Dallas-Fort Worth Metroplex’s submarkets are projected to range between 2.0% and 3.5%, culminating in an overall annual increase of 2.9% for the metroplex. This forecast is particularly promising for the northern suburban submarkets, where rent growth is expected to return to pre-crisis levels. The near-term outlook for the Dallas-Fort Worth rental market is cautiously optimistic. This optimism is underpinned by the region’s strong economic foundation and the ongoing influx of new residents and businesses that has helped the Metroplex lead the nation in population growth.
| Submarket | Q4 2023 Stabilized Occupancy | Q4 2024 Stabilized Occupancy (f) | Annual Occupancy Change (2024/2023) | Q4 2023 Average Monthly Rent | Q4 2024 Average Monthly Rent (f) | Annual Rent Change (2024/2023) |
|---|---|---|---|---|---|---|
| Grand Prairie | 90.9% | 90.5% | -0.5% | $1,432 | $1,483 | 3.5% |
| South Dallas County | 90.5% | 90.1% | -0.4% | $1,344 | $1,389 | 3.4% |
| Hood County | 95.0% | 94.8% | -0.2% | $1,250 | $1,289 | 3.1% |
| North Richland Hills/Haltom City | 92.0% | 91.7% | -0.4% | $1,350 | $1,393 | 3.1% |
| Uptown/Park Cities | 93.0% | 92.8% | -0.2% | $2,374 | $2,449 | 3.1% |
| Irving | 92.4% | 92.1% | -0.3% | $1,256 | $1,295 | 3.1% |
| Grapevine | 95.1% | 94.9% | -0.2% | $1,695 | $1,747 | 3.1% |
| Southeast Fort Worth | 92.4% | 92.1% | -0.3% | $1,416 | $1,460 | 3.1% |
| Far North Dallas | 92.2% | 91.8% | -0.3% | $1,447 | $1,491 | 3.1% |
| Hurst/Euless/Bedford | 93.2% | 93.0% | -0.2% | $1,404 | $1,447 | 3.1% |
| Mesquite | 90.7% | 90.3% | -0.5% | $1,198 | $1,235 | 3.0% |
| Richardson | 91.6% | 91.3% | -0.3% | $1,254 | $1,292 | 3.0% |
| Las Colinas | 92.5% | 92.3% | -0.3% | $1,661 | $1,711 | 3.0% |
| Southeast Dallas | 88.4% | 87.9% | -0.6% | $1,236 | $1,273 | 3.0% |
| Farmers Branch/Carrollton | 93.5% | 93.2% | -0.3% | $1,547 | $1,593 | 3.0% |
| Oak Cliff | 90.6% | 90.2% | -0.4% | $1,323 | $1,362 | 2.9% |
| East Dallas | 92.0% | 91.6% | -0.4% | $1,490 | $1,534 | 2.9% |
| Garland/Rowlett | 92.3% | 92.0% | -0.3% | $1,411 | $1,452 | 2.9% |
| Southwest Fort Worth | 90.1% | 89.7% | -0.4% | $1,310 | $1,348 | 2.9% |
| Northwest Dallas | 91.3% | 91.0% | -0.4% | $1,440 | $1,482 | 2.9% |
| Plano | 93.3% | 93.0% | -0.2% | $1,684 | $1,732 | 2.8% |
| Johnson County | 94.5% | 94.2% | -0.3% | $1,349 | $1,388 | 2.8% |
| Allen/McKinney | 93.4% | 93.2% | -0.3% | $1,608 | $1,652 | 2.8% |
| Denton | 92.4% | 92.1% | -0.3% | $1,389 | $1,427 | 2.8% |
| Northeast Outlying | 88.6% | 88.0% | -0.6% | $1,015 | $1,044 | 2.8% |
| Arlington | 90.1% | 89.7% | -0.5% | $1,293 | $1,328 | 2.7% |
| Ellis County | 91.4% | 91.0% | -0.4% | $1,513 | $1,554 | 2.7% |
| Wise County | 92.0% | 91.2% | -0.9% | $1,472 | $1,512 | 2.7% |
| Lewisville/Flower Mound | 93.1% | 92.8% | -0.3% | $1,556 | $1,598 | 2.7% |
| Frisco/Prosper | 93.2% | 93.0% | -0.2% | $1,760 | $1,807 | 2.6% |
| East Fort Worth | 85.3% | 84.7% | -0.7% | $1,134 | $1,164 | 2.6% |
| West Dallas | 92.2% | 92.0% | -0.3% | $1,787 | $1,833 | 2.6% |
| North Fort Worth | 92.9% | 92.6% | -0.3% | $1,598 | $1,639 | 2.6% |
| Southeast Outlying | 94.2% | 93.9% | -0.3% | $1,215 | $1,246 | 2.6% |
| Northwest Fort Worth | 91.1% | 90.8% | -0.3% | $1,404 | $1,439 | 2.5% |
| Downtown Dallas | 91.5% | 91.3% | -0.3% | $2,173 | $2,226 | 2.5% |
| North Dallas | 92.3% | 92.0% | -0.3% | $1,583 | $1,621 | 2.4% |
| Parker County | 93.9% | 93.6% | -0.3% | $1,480 | $1,512 | 2.1% |
| Downtown Fort Worth | 90.2% | 89.9% | -0.3% | $1,598 | $1,631 | 2.1% |
| Rockwall/Wylie | 89.9% | 89.5% | -0.4% | $1,553 | $1,583 | 2.0% |
| Market | 91.9% | 91.6% | -0.3% | $1,505 | $1,535 | 2.9% |
4Q 2023 Unit Inventory
Number of Units Under Construction
Number of Units UC Delivering
In the Next 4 Quarters
| Submarket | Unit Inventory: 4Q 2023 | Units Under Construction | % of Existing Inventory UC | % of Total UC | Units UC Delivering In the Next 4 Quarters |
|---|---|---|---|---|---|
| Frisco/Prosper | 32,609 | 7,742 | 24% | 12.7% | 3,529 |
| Allen/McKinney | 28,601 | 5,448 | 19% | 9.0% | 1,494 |
| Northwest Fort Worth | 21,051 | 3,661 | 17% | 6.0% | 1,973 |
| Rockwall/Wylie | 8,451 | 3,265 | 39% | 5.4% | 1,375 |
| Denton | 23,528 | 3,109 | 13% | 5.1% | 567 |
| Garland/Rowlett | 25,432 | 2,564 | 10% | 4.2% | 591 |
| Southwest Fort Worth | 37,382 | 2,428 | 6% | 4.0% | 1,599 |
| Far North Dallas | 46,643 | 2,091 | 4% | 3.4% | 794 |
| Farmers Branch/Carrollton | 45,326 | 2,084 | 5% | 3.4% | 806 |
| Southeast Fort Worth | 12,771 | 1,953 | 15% | 3.2% | 562 |
| North Fort Worth | 21,455 | 1,938 | 9% | 3.2% | 852 |
| West Dallas | 6,813 | 1,914 | 28% | 3.1% | 826 |
| Lewisville/Flower Mound | 28,985 | 1,823 | 6% | 3.0% | 944 |
| East Dallas | 62,440 | 1,808 | 3% | 3.0% | 1,107 |
| Ellis County | 6,861 | 1,694 | 25% | 2.8% | 1,065 |
| Uptown/Park Cities | 29,429 | 1,561 | 5% | 2.6% | 1,010 |
| Oak Cliff | 19,260 | 1,426 | 7% | 2.3% | 719 |
| Grand Prairie | 8,567 | 1,229 | 14% | 2.0% | 581 |
| Arlington | 59,022 | 1,209 | 2% | 2.0% | 293 |
| Mesquite | 28,980 | 1,173 | 4% | 1.9% | 453 |
| Las Colinas | 33,006 | 1,155 | 3% | 1.9% | 590 |
| Richardson | 24,606 | 1,095 | 4% | 1.8% | 670 |
| Plano | 47,152 | 1,080 | 2% | 1.8% | 678 |
| Southeast Dallas | 16,936 | 1,073 | 6% | 1.8% | 699 |
| Northwest Dallas | 26,372 | 1,072 | 4% | 1.8% | 740 |
| Downtown Dallas | 9,361 | 951 | 10% | 1.6% | 800 |
| Johnson County | 5,836 | 720 | 12% | 1.2% | 708 |
| South Dallas County | 16,708 | 643 | 4% | 1.1% | 0 |
| Parker County | 4,750 | 524 | 11% | 0.9% | 501 |
| Northeast Outlying | 3,910 | 418 | 11% | 0.7% | 410 |
| Southeast Outlying | 1,512 | 372 | 25% | 0.6% | 297 |
| North Richland Hills/Haltom City | 14,869 | 352 | 2% | 0.6% | 328 |
| Downtown Fort Worth | 3,309 | 283 | 9% | 0.5% | 276 |
| East Fort Worth | 11,295 | 268 | 2% | 0.4% | 0 |
| Wise County | 760 | 240 | 32% | 0.4% | 0 |
| North Dallas | 7,661 | 213 | 3% | 0.4% | 200 |
| Grapevine | 10,066 | 200 | 2% | 0.3% | 0 |
| Hood County | 1,375 | 0 | 0% | 0.0% | 0 |
| Hurst/Euless/Bedford | 22,675 | 0 | 0% | 0.0% | 0 |
| Irving | 27,649 | 0 | 0% | 0.0% | 0 |
| Market | 843,414 | 60,779 | 7.2% | 100.0% | 28,037 |
The multifamily investment sales landscape in Dallas-Fort Worth in 2023 was marked by discrepancies between buyer and seller expectations due to the higher cost of capital, reduced demand in the past year, and an oversupply in certain areas of the Metroplex. Preliminary data from MSCI indicates that single asset, conventional multifamily transactions in the region amounted to $5.1 billion, a significant 54% decrease from 2022, but aligning with transaction volumes seen in the pre-pandemic era. Notably, core properties continued to draw investor interest, while value-add investors showed more caution, contributing to the observed increase in price per unit (PPU).
Dallas’s robust job growth and its competitive edge in affordability continue to make it an attractive market for the future. For discerning investors, 2024 presents potentially lucrative opportunities, particularly if interest rates stabilize, leading to more attractively priced deals. This evolving scenario in the Dallas-Fort Worth multifamily market suggests that well-informed investment strategies could yield significant rewards in the coming year.
*Most Active Buyers and Sellers are based on the sale volume of apartment units.
* Trailing 4Q average PPU
* Preliminary Data from RCA – Individual transaction $2.5M +
P=Preliminary
| Sector | Employment Change 2023 to 2024 | Percent Change |
|---|---|---|
| Overall Employment | 84,100 | 2.0% |
| Manufacturing | 5,200 | 1.7% |
| Construction | 4,400 | 2.0% |
| Trade, Transport., & Utilities | 15,500 | 1.7% |
| Information | 2,200 | 2.3% |
| Financial Activities | 9,200 | 2.4% |
| Professional & Business Services | 17,500 | 2.2% |
| Education & Health Services | 11,800 | 2.4% |
| Government | 8,500 | 1.8% |
| Lesuire & Hospitality | 11,600 | 2.8% |
| Natural Resources & Mining | 3,400 | 17.7% |
| Other Services | 4,800 | 3.3% |
As 2024 starts, the Dallas-Fort Worth metroplex boasts a dynamic and robust economic landscape. The region is a major corporate hub, hosting 24 Fortune 500 and 43 Fortune 1000 companies, including leading entities such as Texas Instruments, AT&T, and McKesson. This concentration of corporate power has significantly contributed to DFW’s leading position in net job growth among U.S. metropolitan areas over the past five years. A notable event this year is the expected launch of Texas Instruments’ $2.2 billion semiconductor fabrication plant, a development set to further stimulate manufacturing employment in the metro.
Complementing this corporate might are substantial enhancements to the DFW International Airport. These upgrades are pivotal in reinforcing DFW’s role as a key hub, not just for business, but also encompassing technology, healthcare, and tourism sectors. This synergy of a potent corporate base and a premier international airport solidifies the metroplex’s status as a thriving economic center, well-positioned for sustained growth and development.