$1,308
average rent
95.0%
average occupancy rate
$212.5M
ytd sales volume

average rent
average occupancy rate
ytd sales volume
YoY rent change
yoy occupancy change
individual transactions
QUARTERLY DEMAND
YTD: 1,469
QUARTERLY COMPLETIONS
YTD: 2,794


In Q2 2023, the Columbus apartment market rebounded, with renters absorbing over 1,400 net units - a notable turnaround after the negative trend in the latter half of 2022. This underscores the resurgence of the local apartment market.
Seven out of ten submarkets reported positive absorption. Notably, the Downtown Columbus/University District led the pack, seeing an absorption of 438 units.
The Columbus apartment inventory expanded by 1,867 units in Q2 2023, with the Downtown Columbus/University District submarket contributing 702 units, making up 38% of the growth.
Developers are focusing on the impressive expansion of the Downtown submarket. Over the past four quarters, it has seen a remarkable addition of 1,376 units to its inventory. This is nearly double the number of units delivered to the Westerville / New Albany / Delaware region during the same period.
The Columbus apartment market, bolstered by factors such as the expanding Ohio State University and upcoming Intel microchip fab site, is expected to thrive in the coming quarters. These drivers will sustain demand despite the increased influx of new units.
Demand is expected to be concentrated in the Downtown Columbus/University District and Reynoldsburg/Far East Columbus submarkets, aligning with the locations of Ohio State University and Intel’s new fab.
Building on its current momentum, the Columbus, OH apartment market anticipates a significant inventory growth of 6,685 units over the coming year.
Consistent with demand predictions, the Downtown Columbus/University District and Reynoldsburg/Far East Columbus submarkets are set to fuel this expansion, expecting to add 2,174 and 1,076 units respectively.
In Q2 2023, the Kansas City apartment market experienced a resurgence in demand with renters absorbing over 1,200 net units, slightly below the seasonal average, but nonetheless highlighting the resilience of the Kansas City apartment market.
Eight out of 11 submarkets posted positive net absorption, with the South Kansas / Grandview submarket leading for absorbed units due to the opening and leasing commencement at two new Class A communities in Belton, which added 700 new units to the submarket.
Q2 2023 saw Kansas City's apartment inventory expand by 1,240 units, with the South Kansas City / Grandview submarket contributing over half with 700 units.
This submarket's rapid growth has caught developers’ attention. Over the past four quarters 1,372 units have been added to the submarket’s inventory, significantly outpacing the Shawnee / Lenexa / Mission submarket's 544 units over the same time frame.
The overall Kansas City, MO-KS apartment market is projected to experience sustained demand over the next four quarters, with an anticipated absorption of 3,052 units. This underscores a steady market outlook for the upcoming period.
Central Kansas City and Olathe/Gardner submarkets are projected to be significant demand hotspots, with expected annual demands of 1,017 units and 1,031 units respectively.
The Kansas City, MO-KS apartment market is set to further expand its inventory over the next four quarters, with a substantial increase of 3,809 units projected.
The Olathe / Gardner and Central Kansas City submarkets are poised to contribute significantly to the new supply, with anticipated additions of 1,224 units and 1,094 units respectively.
Average Monthly Mortgage Payment
Average Monthly Rent
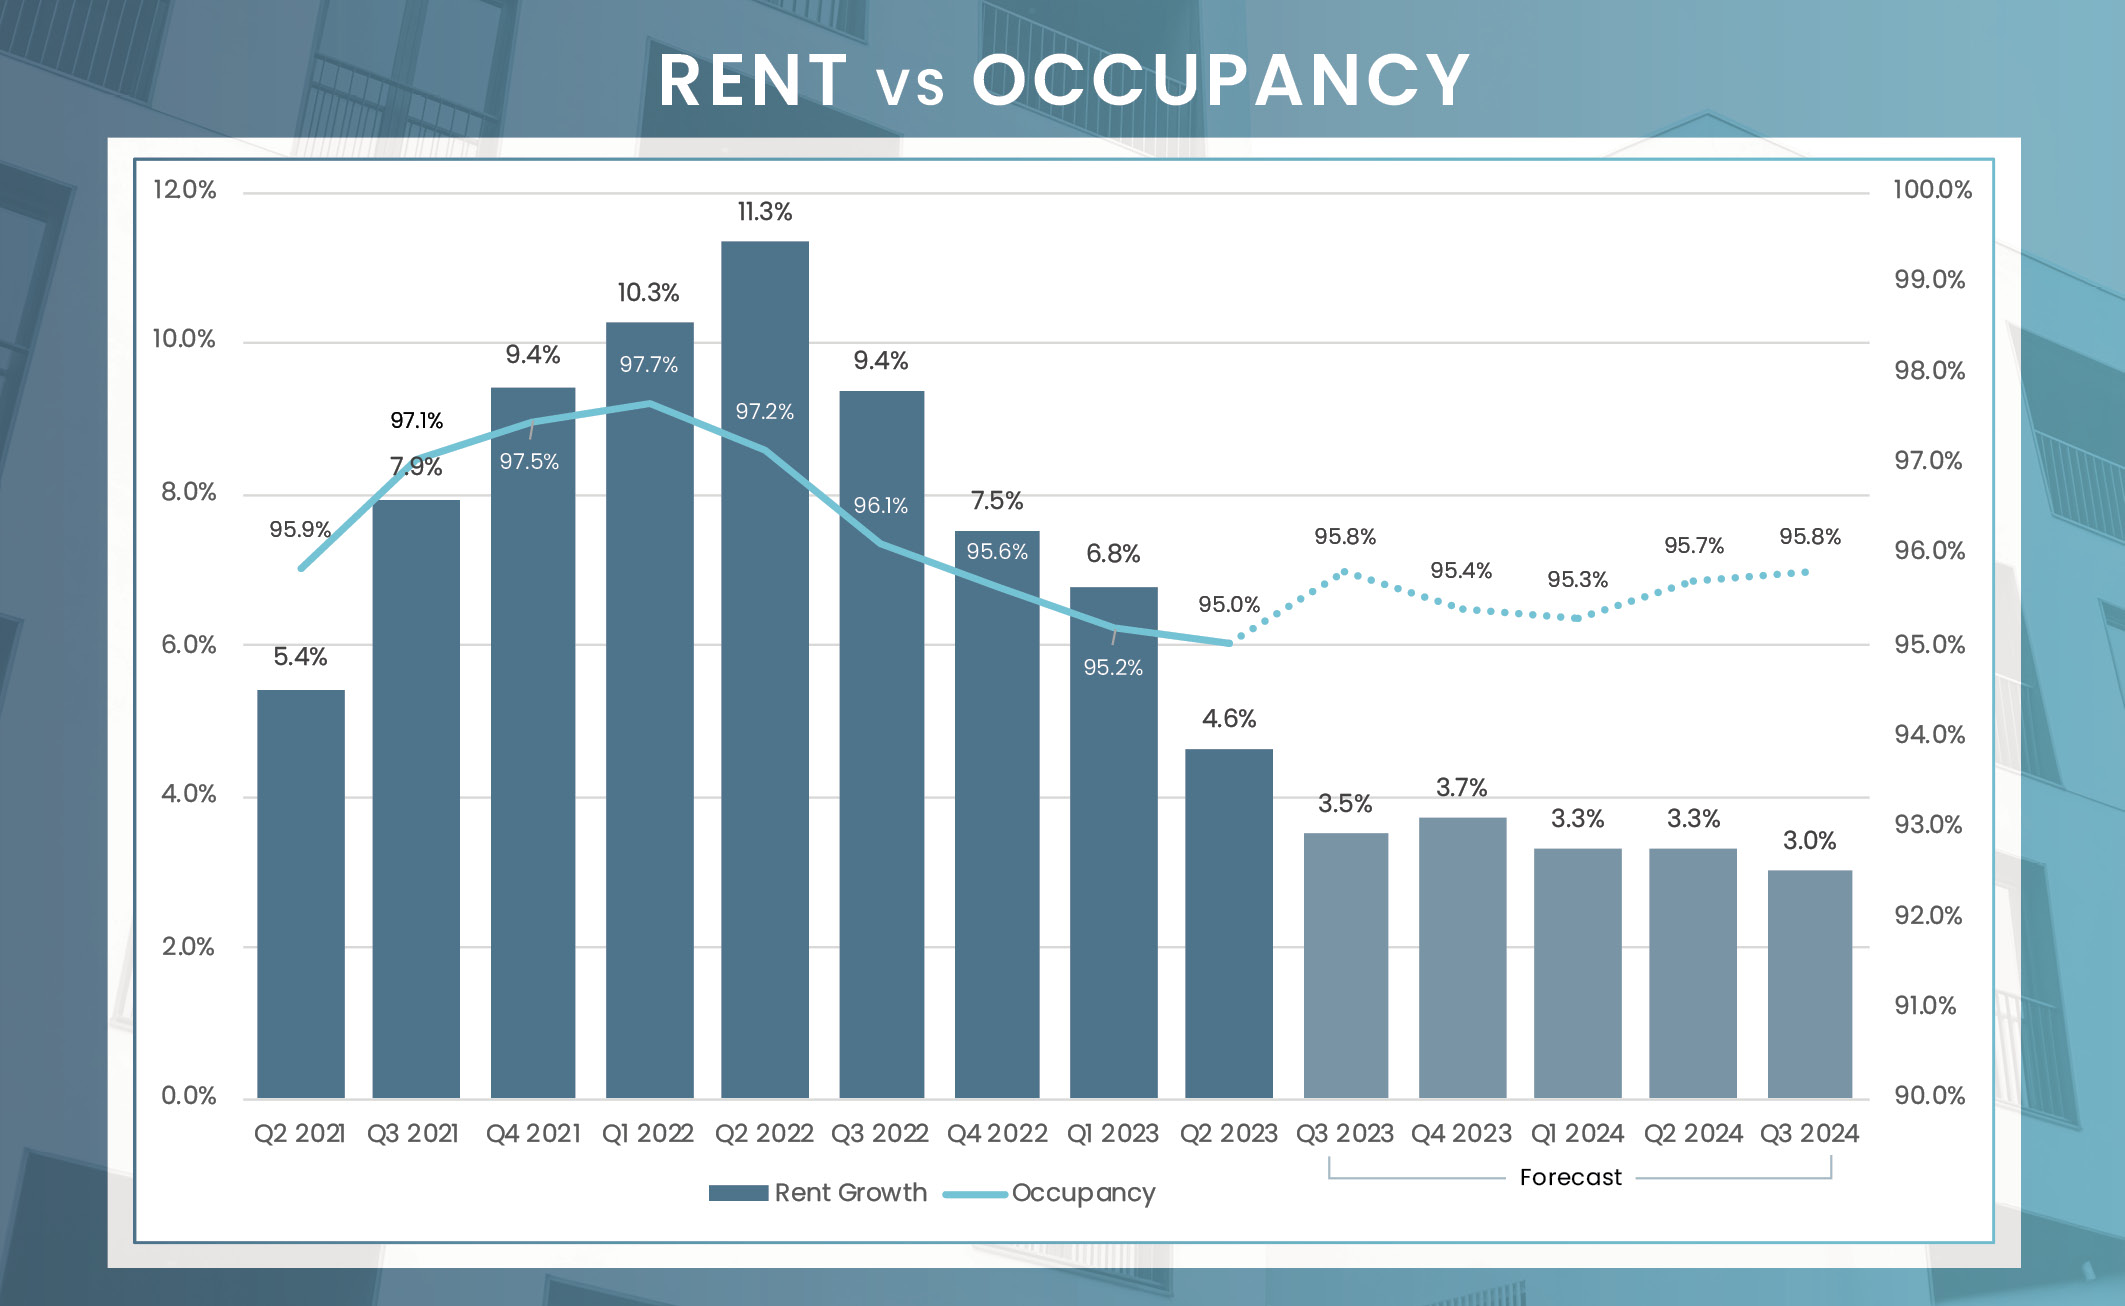
Despite a 2.1 percentage point drop in apartment occupancy over the 12 months ending in June, the Columbus metro area maintained a robust occupancy rate of 95.0%, demonstrating its resilience. Submarket variation was minimal, with occupancy rates between 94.3% and 95.5%. Furthermore, the second quarter brought a positive shift as Class B property occupancy increased by 20 basis points from the previous quarter, signifying a rise in demand for mid-priced housing. Given the projected demand surge, we anticipate a rebound in occupancy rates soon, reinforcing a positive market outlook.
Columbus showcased strong performance in the second quarter of the year, with rents rising 4.6% year-over-year to reach $1,308. The annual growth rate varied across submarkets, peaking at 11.5% in North Central Columbus and reaching a low of 2.8% in the Gahanna/Northeast Columbus area. When comparing asset classes, the growth was less disparate. Class C units, typically the most affordable, led with a 5.7% increase, followed by Class A at 5.0%, and Class B at 3.9%. Among the 10 submarkets monitored by RealPage, the Downtown Columbus/University District retained its position as the priciest, with rents surging to $1,638.
| Submarket | Average Occupancy | Annual Occupancy Change | Average Monthly Rent | Annual Rent Change |
|---|---|---|---|---|
| Downtown Columbus/University District | 94.3% | -2.2% | $1,638 | 5.1% |
| Dublin/Hilliard | 95.4% | -2.7% | $1,470 | 4.4% |
| Gahanna/Northeast Columbus | 95.2% | -1.9% | $1,294 | 2.8% |
| Grove City/South Columbus | 94.9% | -2.4% | $1,171 | 5.3% |
| North Central Columbus | 95.5% | -1.9% | $1,021 | 11.5% |
| Reynoldsburg/Far East Columbus | 95.1% | -1.5% | $1,210 | 2.9% |
| Southeast Columbus | 94.4% | -2.7% | $1,000 | 6.4% |
| Upper Arlington | 95.3% | -2.4% | $1,342 | 4.0% |
| West Columbus | 95.4% | -1.0% | $1,184 | 6.1% |
| Westerville/New Albany/Delaware | 95.0% | -2.3% | $1,444 | 3.0% |
| Columbus, OH | 95.0% | -2.1% | $1,308 | 4.6% |
Units Under Construction
Units UC Delivering In the Next 4 Quarters
Data from Real Capital Analytics shows that individual conventional multifamily transactions in Columbus, OH, totaled approximately $212.5 million in the first half of 2023. Despite a 41% year-over-year drop in volume, this figure aligns with pre-pandemic transaction averages, indicating that investors continue to pursue and close deals. While a rapid rise in interest rates has softened sales activity nationwide, Columbus has remained resilient, closely mirroring pre-pandemic sales volume trends. In fact, Columbus’ trade volume is about 25% above its five-year historical average for this period, underscoring the market’s relative stability. Examining the investor landscape, private investors maintain their position as the dominant market players, accounting for all individual transactions in the first half of the year.
* Trailing 4Q average PPU
* Preliminary Data from RCA – Individual transaction $2.5M +
In May 2023, the job market in the Columbus, OH Metro area exhibited remarkable strength, as reported by the Bureau of Labor Statistics (BLS). The addition of 16,200 new positions showcased a job growth rate of 1.4%, surpassing the rate of 1.0% reported in March. Various sectors within the region experienced substantial job gains, with the Mining, logging, and construction sector leading the way by adding 6,100 new jobs, representing an impressive 12.6% annual increase. Following closely behind was the leisure and hospitality sector, which saw the addition of 4,700 jobs, expanding by 4.4%. In terms of unemployment, Columbus’s rate remained low at 3.0% in May, a decrease of 10 basis points from the previous year and well below the national average of 3.4%. These statistics underscore the resilience of Columbus’s economy, characterized by its diverse range of industries.
May Annual Jobs Created
May 23 Employment growth
May 23 Unemployment rate
3.4% us may rate
Change from May 2022
to May 2023: 6,100
Percent Change: 12.6%
Change from May 2022
to May 2023: 4,700
Percent Change: 4.4%
Change from May 2022
to May 2023: 3,800
Percent Change: 2.1%
Change from May 2022
to May 2023: 2,800
Percent Change: 6.7%
Change from May 2022
to May 2023: 2,500
Percent Change: 1.6%
| Sector | Change from May 2022 to May 2023 | Percent Change |
|---|---|---|
| Mining, logging, and construction | 6,100 | 12.6% |
| Leisure and hospitality | 4,700 | 4.4% |
| Government | 3,800 | 2.1% |
| Other services | 2,800 | 6.7% |
| Education and health services | 2,500 | 1.6% |
| Professional and business services | 0 | 0.0% |
| Manufacturing | -200 | -0.3% |
| Information | -500 | -2.7% |
| Trade, transportation, and utilities | -1,200 | -0.5% |
| Financial activities | -1,800 | -2.1% |


Columbus has consistently demonstrated solid rental performance, underpinned by a steady economy, even amidst recent economic fluctuations. Despite a temporary dip in demand during the latter half of 2022, the market is projected to rebound, with RealPage forecasting renters to absorb 7,500 units over the next four quarters. This will surpass the new unit inventory expected to be available over the same period. Of the 11,500 housing units currently under construction, 6,685 are slated for delivery by the end of Q2 2024. Factors such as high occupancy rates, strong annual rent growth, and moderate yet consistent apartment completions contribute to a positive outlook for the Columbus market.


This website uses cookies so that we can provide you with the best user experience possible. Cookie information is stored in your browser and performs functions such as recognising you when you return to our website and helping our team to understand which sections of the website you find most interesting and useful.
Strictly Necessary Cookie should be enabled at all times so that we can save your preferences for cookie settings.
If you disable this cookie, we will not be able to save your preferences. This means that every time you visit this website you will need to enable or disable cookies again.