$1,237 4Q 2023
$1,282 4Q 2024
3.6%
93.7% 4Q 2023
93.4% 4Q 2024
-40 BASIS POINTS
1.15M 2023
1.17M 2024
3.1% 2023
3.8% 2024
* Please note that these employment figures have been adjusted for seasonal variations and are based on Moody’s Analytics forecast as of January 1, 2024.
** Please note that these unemployment rates are estimates that have not been adjusted for seasonal variations, and they are derived from Moody’s Analytics forecast as of January 1, 2024.
FORECASTED ABSORPTION
FORECASTED NEW SUPPLY

In 2024, the Columbus, OH apartment market is poised for subtle shifts, primarily driven by the dynamic interplay of supply and demand. The projected absorption of 5,322 units highlights a healthy absorption rate, yet this is tempered by an anticipated increase in supply, with 6,396 units entering the market. This imbalance suggests a potential challenge for operators to grow occupancies, especially in the Class A segment, which is most susceptible to competition from new developments. Despite this, the occupancy rate, which was a solid 93.7% in the fourth quarter of 2023, is only expected to see a marginal decrease to 93.4% by the fourth quarter of 2024.
Columbus, renowned as a leading Midwest metro, has experienced a significant population surge over the past decade. This growth has been further fueled by substantial investments from major corporations like Intel and Honda, which have been instrumental in job creation, thereby bolstering housing demand as new employees migrate to the region. Looking ahead, a forecasted reduction in construction starts is likely to decelerate the pace of new apartment deliveries from late 2024 into 2025. This slowdown is expected to gradually bring demand and supply into closer alignment, stabilizing the market.
With 9,000 units currently under construction, which is approximately 4% of the total market inventory, the market is seeing a manageable increase in its rental housing inventory. This construction activity, particularly in key areas like Upper Arlington with 1,927 units, Delaware County hosting 1,767 units, and Downtown Columbus with 1,538 units, is set to exert additional pressure on occupancy rates in these submarkets. These regions have been recognized as consistent development hotspots in recent years, contributing significantly to the expected deliveries over the next 12 months.
However, the local developers are experiencing the impact of rising construction financing costs, which have led to a reduction in the number of new construction starts from their mid-2022 peak. This trend suggests that the pace of new rental housing deliveries might begin to slow down as we approach 2025. Such a slowdown could potentially lead to a market scenario where the demand for housing gradually begins to outstrip the supply, reshaping the market dynamics in Columbus in the operators’ favor.
Average Monthly Mortgage Payment
Average Monthly Rent
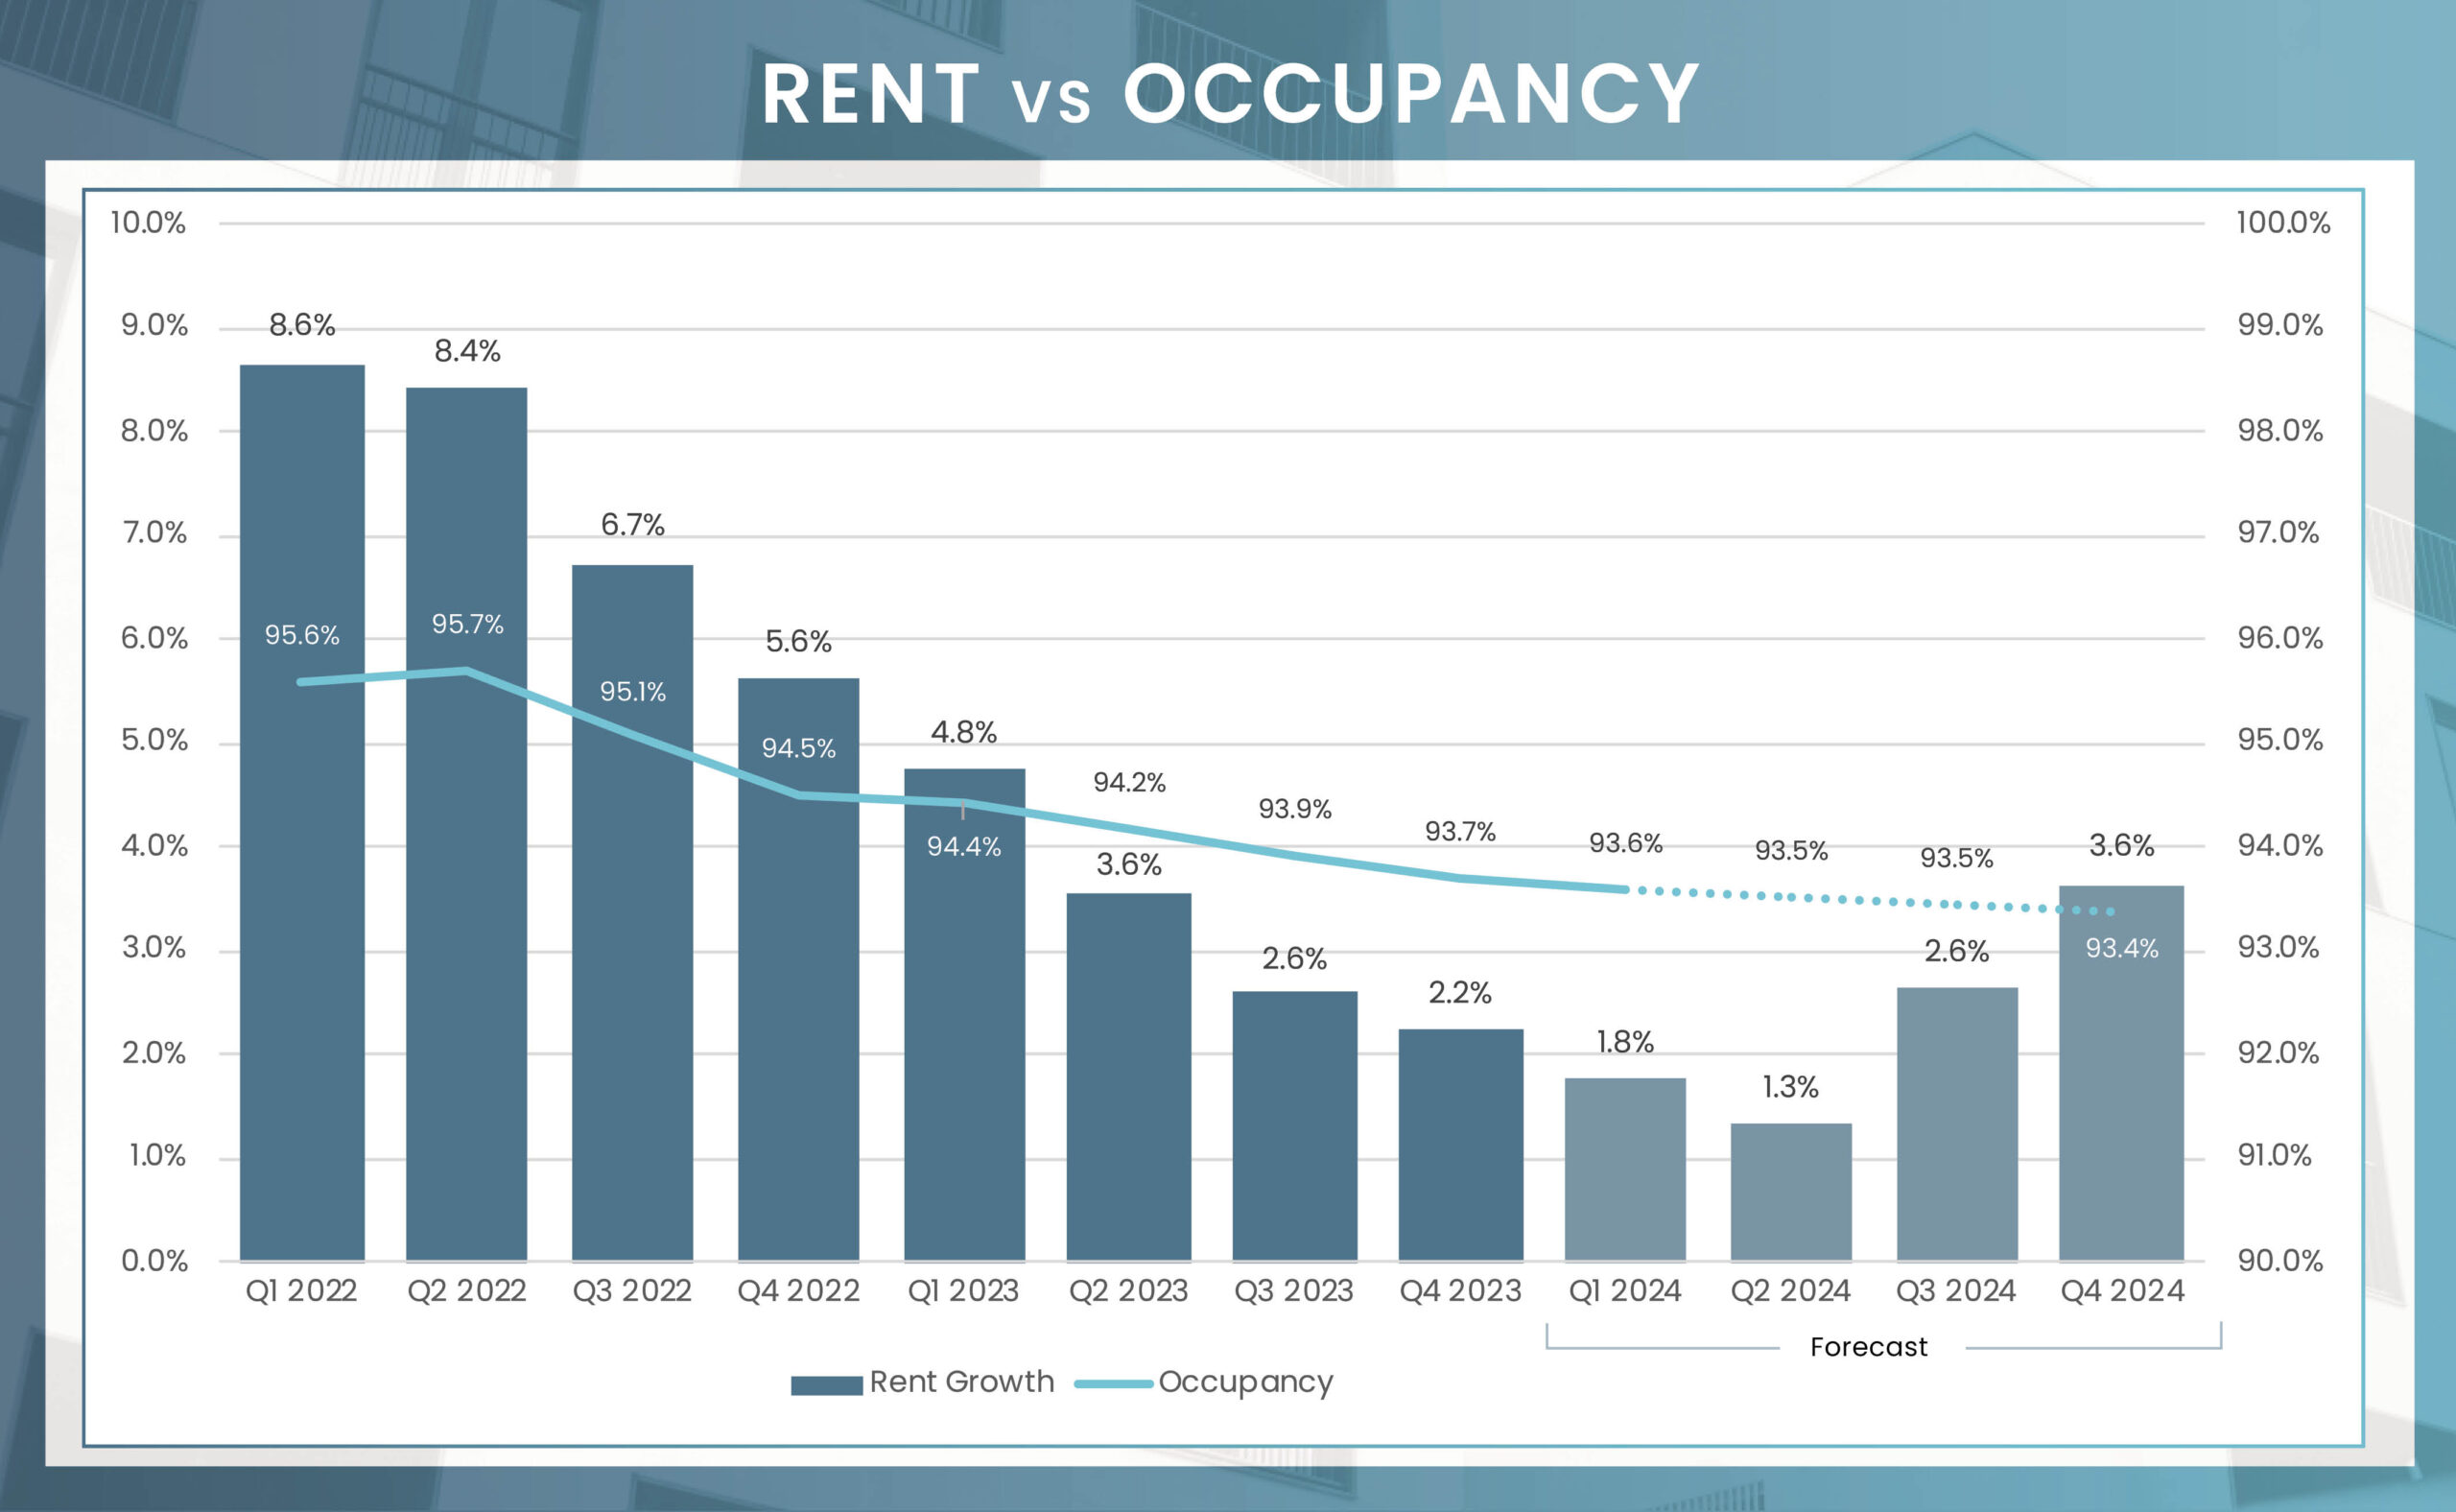
Columbus has emerged as a top 10 market for rent growth over the past year, mirroring trends seen in various other Midwest markets. This growth has been supported by relatively moderate construction activity, especially when compared to more aggressive development pipelines in sunbelt regions. As we look towards 2024, the rental market in Columbus is on track for another year of strong performance. Rent growth across all submarkets is forecasted to range between 3.3% and 4.2%, significantly outperforming the broader national average. At the market level, rent growth in Columbus is expected to reach 3.6% by the end of the year.
Interestingly, the strongest rent growth is anticipated in the outlying submarkets. Although these areas may not see the same level of demand as urban and closer suburb submarkets, their limited development activity supports more consistent, albeit moderate, growth. In contrast, urban areas this year, feeling more pressure from new supply, like downtown Columbus are likely to experience slower growth compared to these outlying regions, which are known for their essential “bread-and-butter” properties.
Despite these regional variations, the overall Columbus market is expected to maintain its comparative affordability. Urban rents, such as in Downtown Columbus, currently average around $1,561, while more budget-friendly areas like Pickaway County are projected to have an average monthly rent of around $1,090. The near-term outlook for the Columbus rental market remains robust, bolstered by a solid economic foundation and a stable core of key renter demographics. This positions the Columbus rental market for continued strength and resilience, reflecting a positive trend for the region’s real estate sector.
| Submarket | Q4 2023 Stabilized Occupancy | Q4 2024 Stabilized Occupancy (f) | Annual Occupancy Change (2024/2023) | Q4 2023 Average Monthly Rent | Q4 2024 Average Monthly Rent (f) | Annual Rent Change (2024/2023) |
|---|---|---|---|---|---|---|
| Bexley/Whitehall | 93.8% | 93.4% | -0.4% | $1,024 | $1,063 | 3.8% |
| Delaware County | 94.8% | 94.5% | -0.3% | $1,430 | $1,482 | 3.6% |
| Downtown Columbus | 92.5% | 92.2% | -0.3% | $1,506 | $1,561 | 3.6% |
| Dublin/Hilliard | 93.6% | 93.2% | -0.3% | $1,325 | $1,372 | 3.6% |
| Fairfield County | 95.7% | 95.5% | -0.3% | $1,237 | $1,282 | 3.6% |
| Greater Hilltop | 94.4% | 94.0% | -0.4% | $1,121 | $1,164 | 3.9% |
| Licking County | 97.0% | 96.8% | -0.2% | $1,101 | $1,143 | 3.8% |
| Madison County | 99.1% | 98.9% | -0.2% | $1,288 | $1,333 | 3.5% |
| Morrow County | 96.2% | 95.9% | -0.4% | $587 | $612 | 4.2% |
| Northeast Columbus | 93.8% | 93.4% | -0.4% | $1,178 | $1,219 | 3.5% |
| Pickaway County | 96.7% | 96.4% | -0.3% | $1,050 | $1,091 | 3.9% |
| Southern Columbus | 91.1% | 90.7% | -0.5% | $1,118 | $1,155 | 3.3% |
| Union County | 96.8% | 96.6% | -0.2% | $1,413 | $1,466 | 3.8% |
| Upper Arlington | 93.5% | 93.1% | -0.4% | $1,323 | $1,373 | 3.8% |
| Market | 93.7% | 93.4% | -0.4% | $1,237 | $1,282 | 3.6% |
4Q 2023 Unit Inventory
Number of Units Under Construction
Number of Units UC Delivering
In the Next 4 Quarters
| Submarket | Unit Inventory: 4Q 2023 | Units Under Construction | % of Existing Inventory UC | % of Total UC | Units UC Delivering In the Next 4 Quarters |
|---|---|---|---|---|---|
| Bexley/Whitehall | 24,967 | 533 | 2.1% | 5.9% | 451 |
| Delaware County | 13,183 | 1,767 | 13.4% | 19.5% | 1,146 |
| Downtown Columbus | 12,695 | 1,538 | 12.1% | 17.0% | 897 |
| Dublin/Hilliard | 33,376 | 0 | 0.0% | 0.0% | 0 |
| Fairfield County | 6,457 | 0 | 0.0% | 0.0% | 0 |
| Greater Hilltop | 14,353 | 264 | 1.8% | 2.9% | 0 |
| Licking County | 5,761 | 372 | 6.5% | 4.1% | 369 |
| Madison County | 886 | 588 | 66.4% | 6.5% | 587 |
| Morrow County | 240 | 0 | 0.0% | 0.0% | 0 |
| Northeast Columbus | 38,718 | 699 | 1.8% | 7.7% | 685 |
| Pickaway County | 1,472 | 0 | 0.0% | 0.0% | 0 |
| Southern Columbus | 18,351 | 1,120 | 6.1% | 12.4% | 825 |
| Union County | 3,154 | 241 | 7.6% | 2.7% | 228 |
| Upper Arlington | 37,731 | 1,927 | 5.1% | 21.3% | 1,208 |
| Market | 211,344 | 9,049 | 4.3% | 100% | 6,396 |
As we enter 2024, the investment scene in Columbus can be described as moderate. The final quarter of 2023 concluded with a total of six individual assets changing hands, amounting to $149.3 million. The overall transaction volume for the year comprised 24 deals, amounting to $542.9 million. This represents a 31.5% decline from the previous year. While any drop in market transaction activity year-over-year isn’t particularly encouraging, it’s worth noting that Columbus’s decrease was considerably less severe compared to the approximately 65% fall in multifamily investment sales at the national level.
In terms of the 2023 transactions, there was a noticeable shift in the buyer profile. The focus moved from developers and private REITs to individual buyers. This shift is evident in the types of assets that dominated the trades last year, with smaller Class B and C properties accounting for the majority of deals. Looking ahead, the Columbus market retains its attractiveness, largely thanks to its robust job growth and relative affordability. These elements are anticipated to offer attractive opportunities, particularly if interest rates find a stable footing. While investors might initially approach with caution, potentially biding their time for pricing adjustments in the near future, the latter half of the year will likely see an uptick in transaction activity in the Columbus market.
*Most Active Buyers and Sellers are based on the sale volume of apartment units.
* Trailing 4Q average PPU
* Preliminary Data from RCA – Individual transaction $2.5M +
P=Preliminary

| Sector | Employment Change 2023 to 2024 | Percent Change |
|---|---|---|
| Overall Employment | 6,900 | 0.6% |
| Manufacturing | 400 | 0.5% |
| Construction | 1,300 | 2.8% |
| Trade, Transport., & Utilities | 500 | 0.2% |
| Information | 300 | 1.1% |
| Professional & Business Services | 1,000 | 0.5% |
| Education & Health Services | 3,200 | 2.0% |
| Government | 4,000 | 2.2% |
| Lesuire & Hospitality | 100 | 0.0% |
Columbus’ multifamily market truly stands out in the Midwest, exemplifying remarkable stability and resilience. This strength is primarily underpinned by a unique combination of factors. Central to this stability is the consistent demand generated by the presence of the state government and Ohio State University, which not only provide a steady stream of residents but also sustain a robust job market.
The solidity of Columbus’ multifamily market is further augmented by the anticipated job growth in the region. Projections indicate an addition of 4,000 government workers, complemented by a significant increase of 3,800 jobs in the education and health services sectors by the end of the year. Moreover, Columbus has a unique corporate appeal that surpasses many other Midwestern cities. A prime example of this is Intel’s landmark investment in a $20 billion semiconductor hub, representing the largest investment of its kind in the state.
This blend of steady demand, burgeoning job opportunities, and a strong corporate presence positions Columbus’ multifamily market as a beacon of stability and a highly attractive investment destination in the Midwest. The market’s unique characteristics make it a compelling choice for investors looking for a blend of security and growth potential in the region.