$1,201 4Q 2023
$1,256 4Q 2024
4.5%
94.7% 4Q 2023
94.4% 4Q 2024
-30 points
1.16M 2023
1.17M 2024
3.2% 2023
4.0% 2024
* Please note that these employment figures have been adjusted for seasonal variations and are based on Moody’s Analytics forecast as of January 1, 2024.
** Please note that these unemployment rates are estimates that have not been adjusted for seasonal variations, and they are derived from Moody’s Analytics forecast as of January 1, 2024.
The Cincinnati market is projected to experience strong demand for multifamily units, with an expected absorption of 2,043 units over the coming year. This vigorous demand, alongside the anticipation of maintaining healthy occupancy levels above 94%, indicates a stable and thriving market environment.
Cincinnati is on track for moderate expansion, with nearly 60% of the 4,134 units currently under-construction expected to be completed by the end of 2024. This new supply, especially in high-demand areas like suburban Northern Kentucky, indicates a vibrant and expanding housing market.
Market rent growth is projected to increase by 4.5% in the coming year, a significant 150-basis point improvement from the previous year. This growth is indicative of the city’s appealing affordability and consistent population growth, positioning it well within the Midwest region.
Economic outlook for Greater Cincinnati is highly positive, with the region set to create approximately 11,600 new jobs in the next year. Key expansions in major sectors, such as Professional & Business Services and Education & Health Services, underscore the area’s strong and skilled workforce. Corporate expansions and new developments, including Medpace’s investment, Worldpay’s relocation, and the new Margaritaville resort, are poised to inject further vitality into the local economy.
FORECASTED ABSORPTION
FORECASTED NEW SUPPLY
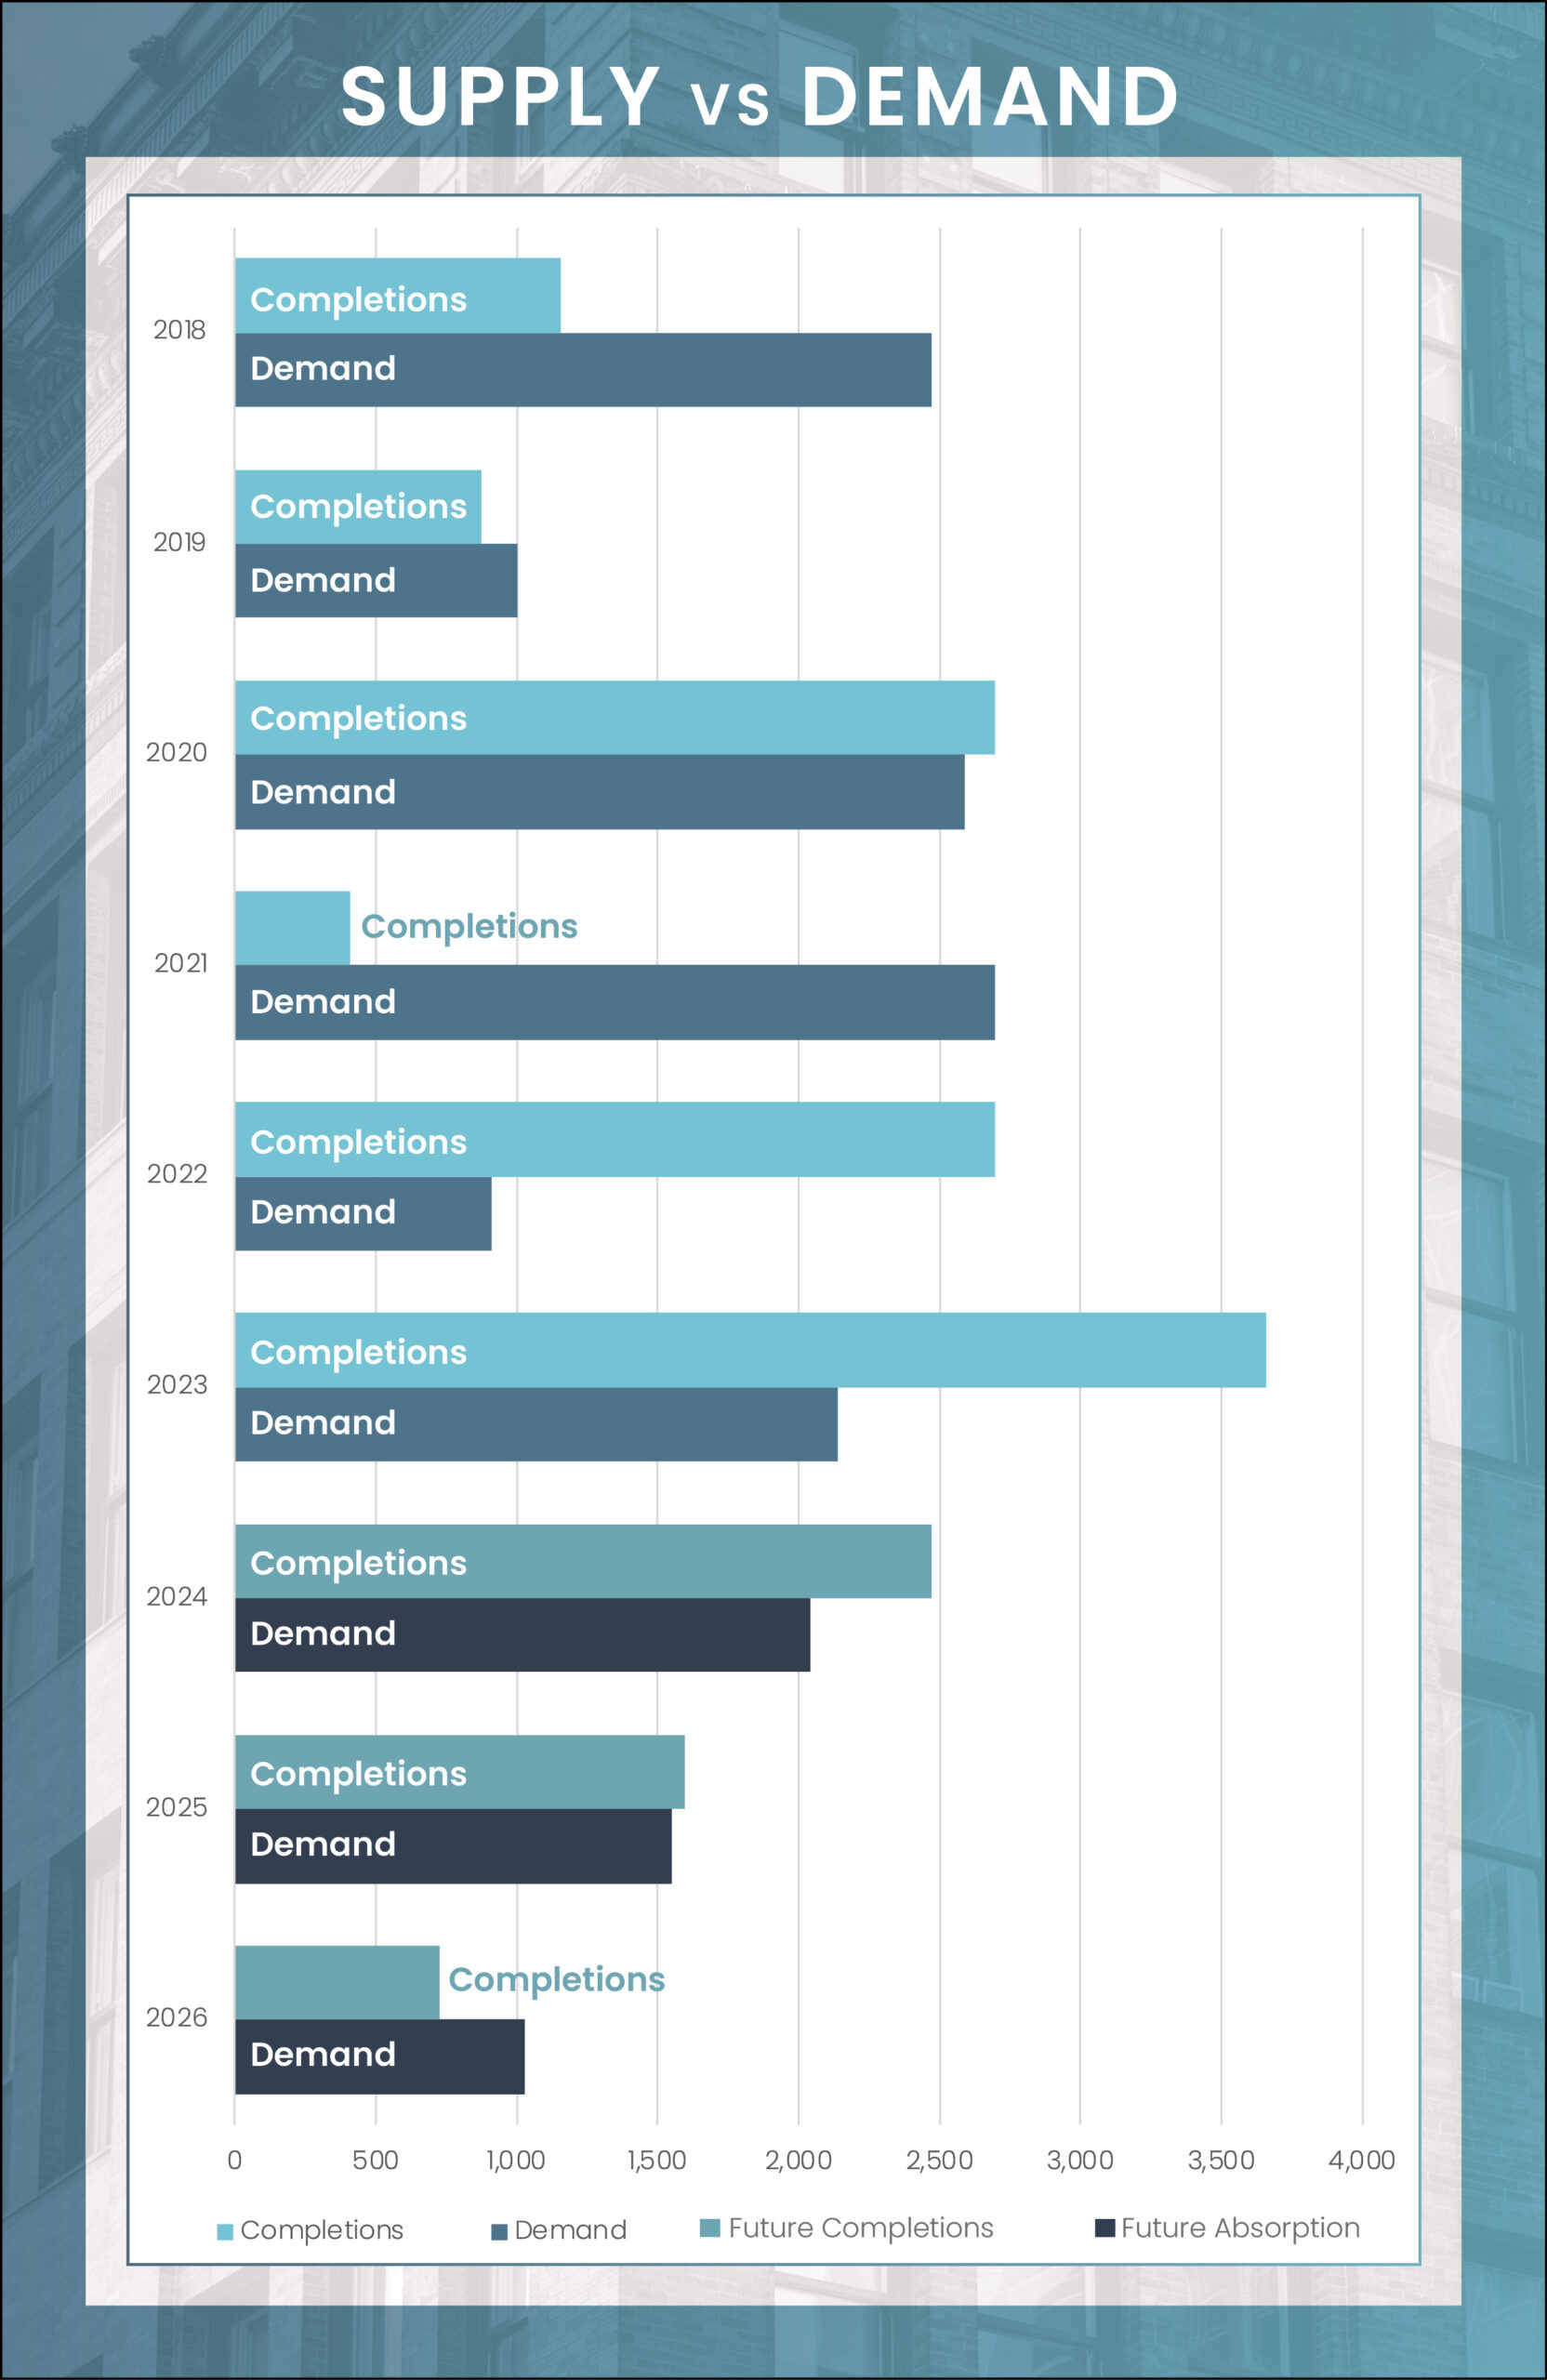
The Cincinnati multifamily market has witnessed a marked uptick in demand, with 2023 net absorption reaching 2,136 units, surpassing the pre-pandemic three-year average. As we move into 2024, demand is projected to stay robust, with an expected absorption of 2,043 units over the next 12 months, as supply begins to normalize. The market is poised for further strengthening, with demand likely to exceed new completions by 2026. Key contributors to this demand are anticipated to be the Outlying East and North Cincinnati areas, contributing 24% and 21% of the annual demand, respectively. Occupancy levels, having peaked at 94.7% in the last quarter of 2023, are forecasted to see a marginal decrease, settling around 94.4% in the next year. Across various submarkets, occupancy rate fluctuations are expected to be minimal.
The Cincinnati Metropolitan apartment market is experiencing its highest rate of new unit completions in nearly a decade. In the last year, 3,658 units were completed, which is over twice the average seen before the pandemic. Currently, there are 4,134 units under construction across seven of the metro’s 14 submarkets, signaling an upcoming 3% increase in supply. Notably, close to 60% of these units are expected to be completed by the end of 2024, with a significant part of this development happening in Northern Kentucky, a highly desirable suburban area accounting for 33% of the ongoing construction.
In prime areas like Downtown and Northeast Cincinnati, the surge of new inventory is set to notably alter market dynamics. However, this growth may be moderated by persistent labor and material shortages, potentially leading to construction delays and a better balance between demand and supply. Furthermore, the rising costs of construction financing are slowing the pace of development, resulting in fewer new projects. This deceleration could push back the timeline for new unit deliveries to late 2025, potentially creating a scenario, for the first time since early 2023, where demand exceeds the available supply.
Average Monthly Mortgage Payment
Average Monthly Rent

Greater Cincinnati’s multifamily rent growth is on a rising trend, with projections showing a 4.5% increase in the coming year, a step up from the 3.0% year-over-year growth observed in 2023. This rate significantly surpasses the national average. Factors like the city’s appealing affordability, steady population growth, and a moderate pace of development compared to other U.S. regions are driving this trend. Cincinnati OH-KY stands in a mid-range position for rent growth among other Midwest markets, indicative of its consistent market performance.
Specifically, in areas like Northwest Cincinnati and the Northern Kentucky Submarket, where new housing developments are scarce, rent growth is expected to be robust, with forecasts showing annual increases of approximately 5.2% and above 4%, respectively. Meanwhile, Cincinnati’s overall rental rates continue to be more affordable than many regional counterparts. By the end of 2024, average rents in Cincinnati are expected to be over 25% lower than the national average. However, the city’s rental market is diverse, catering to various budget ranges. For cost-conscious renters, areas like Brown County offer rents as low as $380 per month. On the other hand, more upscale regions like Downtown Cincinnati, Northeast Cincinnati, and Northern Kentucky feature rents that are up to 20% higher than the city’s average. Looking into the future, the outlook for Cincinnati’s rent growth remains positive, with anticipated average increases likely to surpass historical norms in the upcoming years.
| Submarket | Q4 2023 Stabilized Occupancy | Q4 2024 Stabilized Occupancy (f) | Annual Occupancy Change (2024/2023) | Q4 2023 Average Monthly Rent | Q4 2024 Average Monthly Rent (f) | Annual Rent Change (2024/2023) |
|---|---|---|---|---|---|---|
| Brown County | 97.3% | 97.6% | 0.3% | $362 | $380 | 4.9% |
| Dearborn County | 97.5% | 97.8% | 0.3% | $1,218 | $1,276 | 4.8% |
| Downtown Cincinnati | 92.6% | 93.0% | 0.4% | $1,312 | $1,369 | 4.3% |
| East Cincinnati | 93.5% | 93.9% | 0.4% | $1,183 | $1,234 | 4.3% |
| Gallatin County | 97.9% | 98.2% | 0.3% | $687 | $720 | 4.8% |
| Grant County | 97.6% | 97.9% | 0.3% | $714 | $748 | 4.8% |
| North Cincinnati | 94.5% | 94.8% | 0.4% | $1,227 | $1,284 | 4.7% |
| North Hamilton | 95.7% | 96.0% | 0.3% | $1,092 | $1,142 | 4.6% |
| Northeast Cincinnati | 95.4% | 95.7% | 0.3% | $1,445 | $1,512 | 4.6% |
| Northern Kentucky | 94.2% | 94.6% | 0.3% | $1,237 | $1,292 | 4.5% |
| Northwest Cincinnati | 94.7% | 95.1% | 0.4% | $910 | $957 | 5.2% |
| Outlying East | 94.9% | 95.2% | 0.3% | $1,183 | $1,235 | 4.4% |
| Market | 94.7% | 94.4% | -0.3% | $1,201 | $1,256 | 4.5% |
4Q 2023 Unit Inventory
Number of Units Under Construction
Number of Units UC Delivering
In the Next 4 Quarters
| Submarket | Unit Inventory: 4Q 2023 | Units Under Construction | % of Existing Inventory UC | % of Total UC | Units UC Delivering In the Next 4 Quarters |
|---|---|---|---|---|---|
| Brown County | 224 | 0 | 0% | 0.0% | 0 |
| Dearborn County | 354 | 0 | 0% | 0.0% | 0 |
| Downtown Cincinnati | 19,375 | 553 | 3% | 13.4% | 166 |
| East Cincinnati | 17,177 | 392 | 2% | 9.5% | 373 |
| Gallatin County | 210 | 0 | 0% | 0.0% | 0 |
| Grant County | 499 | 0 | 0% | 0.0% | 0 |
| North Cincinnati | 16,502 | 327 | 2% | 7.9% | 320 |
| North Hamilton | 12,135 | 0 | 0% | 0.0% | 0 |
| Northeast Cincinnati | 14,752 | 688 | 5% | 16.6% | 363 |
| Northern Kentucky | 24,796 | 1,352 | 5% | 32.7% | 596 |
| Northwest Cincinnati | 17,177 | 449 | 3% | 10.9% | 313 |
| Ohio County | 19 | 0 | 0% | 0.0% | 0 |
| Outlying East | 16,118 | 373 | 2% | 9.0% | 340 |
| Pendleton County | 77 | 0 | 0% | 0.0% | 0 |
| Market | 139,415 | 4,134 | 3.0% | 100.0% | 2,471 |
In the past year, sales of individual multifamily assets in the Cincinnati, OH-KY metro area have significantly declined due to high interest rates, with deal volume dropping to $242.7 million, a 44% decrease. Despite this downturn, these figures are still close to the pre-pandemic five-year annual average of $262 million. The buyer landscape in Cincinnati’s multifamily market has shifted recently, moving away from larger deals. While institutional investors typically form a minor segment of this market, there has been no significant activity from them this year. Instead, private buyers, including developers and individuals, have dominated the major sales in 2023. The current economic uncertainty and weakening market fundamentals are expected to impact deal volumes in the coming months. Investors might remain cautious, leading to continued inactivity from institutional players. The limited size and quality of assets available also contribute to these lower transaction volumes. Nevertheless, the Cincinnati market continues to attract investors looking for higher returns, especially those priced out of larger markets.
*Most Active Buyers and Sellers are based on the sale volume of apartment units.
* Trailing 4Q average PPU
* Preliminary Data from RCA – Individual transaction $2.5M +
P=Preliminary

| Sector | Employment Change 2023 to 2024 | Percent Change |
|---|---|---|
| Overall Employment | 11,600 | 1.0% |
| Education & Health Services | 5,600 | 3.2% |
| Lesuire & Hospitality | 4,100 | 3.1% |
| Trade, Transport., & Utilities | 1,800 | 0.8% |
| Construction | 1,300 | 2.7% |
| Government | 900 | 0.7% |
| Other Services | 300 | 0.7% |
| Information | 200 | 0.7% |
| Professional & Business Services | 0 | 0.1% |
| Manufacturing | (200) | -0.2% |
| Financial Activities | (600) | -0.8% |
In recent years, the Greater Cincinnati area has demonstrated impressive job growth. By December 2023, there was a 2.7% annual increase in overall employment, ending the year with a low unemployment rate of 3.2%, which is significantly better than the national average. Over the next year, the region is expected to create around 11,600 new jobs. The primary employment sector, after Trade, Transport, and Utilities, is Professional & Business Services, accounting for about 17% of the job market. This sector highlights the area’s strong and skilled workforce. Additionally, the Education & Health Services sector is set to experience significant growth, expecting to expand by 3.2% and add approximately 5,600 jobs in the upcoming year.
Cincinnati’s short-term economic outlook is very optimistic. The city already serves as a hub for five major Fortune 500 companies, such as Kroger, Procter & Gamble, Cintas, Western & Southern Financial, and Fifth Third Bancorp. Adding to this, several significant corporate expansions are underway, promising further economic stimulation. A key development is the expansion of the biotech firm Medpace, involving a $230 million investment and the introduction of 1,500 new high-paying jobs. Additionally, the global fintech leader Worldpay is reinstating its headquarters in Cincinnati, a move that includes a multi-million-dollar investment and the creation of 500 new jobs. Moreover, a $140 million state-of-the-art Margaritaville resort is set to open in northern Kentucky by early 2026, anticipated to add approximately 200 jobs to the local economy, thereby enhancing the region’s economic development.