Chicago 3Q23
Multifamily Market Report

$1,964

average rent

95.3%

average occupancy rate

$1.5B

ytd sales volume

3.5%

YoY rent change

-0.5 POINTS

yoy occupancy change

80 YTD

individual transactions

Supply & Demand

3Q23

500 Units

QUARTERLY DEMAND
YTD: 7,053

1,828 Units

QUARTERLY COMPLETIONS
YTD: 6,317

Annual Demand vs Completions

2018
12,505
9,176
2019
12,522
10,301
2020
1,292
8,643
2021
25,434
7,411
2022
-4,903
5,950
2023 YTD
7,053
6,317
  • Planned
    Completions
  • Pre-Planned
    Demand

Demand Trends

  • In Q3 2023, the Chicago apartment market experienced a more subdued quarter of demand, with renters absorbing 500 units. Although this figure was lighter compared to previous 3Q totals, it still marks the third consecutive quarter of positive demand, and significantly, absorption continues to outpace the new units added to the inventory for the year.
  • Out of the 20 Chicagoland submarkets, 12 posted positive net absorption. The South Cook County submarket led in absorption with 427 newly filled units. In contrast, the Evanston/Rogers Park/Uptown submarket recorded the highest net move-outs at 1,267.

Completion Trends

  • In the third quarter of 2023, the Chicago apartment inventory expanded by 1,828 units. The new units delivered during this quarter were generally distributed evenly across the submarkets with ongoing construction, with the Evanston/Rogers Park/Uptown submarket recording the highest number of new completions for the quarter at 505.
  • Over the previous four quarters, there were 7,384 new apartment completions, which is slightly below the pace of deliveries set over the preceding five years. However, the pace of deliveries is anticipated to return to more typical levels in the upcoming four quarters.

Demand Outlook

  • Chicago’s apartment market is projected to normalize over the course of the next four quarters, propelled by strong employment gains in the metro area. According to the latest data from the Bureau of Labor Statistics, Chicago experienced a steady year-over-year increase of nearly 51,000 jobs in August. These employment gains are anticipated to have a direct impact on the residential sector, driving new household formation and fostering sustained demand into 2024.
  • With the pandemic receding further into the past, employees are gradually returning to their office spaces. This shift is poised to reignite interest in the previously hard-hit downtown residential area. As the return to office trend gains momentum, an uptick in demand and increased residential activity in the city core and adjacent neighborhoods can be expected in the coming months.

New Supply Outlook

  • While Chicago is considered a prominent gateway market, it still exhibits some key features typical of traditional Midwest apartment markets. Unlike several other core and core plus markets grappling with excessive construction pipelines, Chicago’s current construction pipeline comprises 13,000 units, which amounts to a mere 1.8% of the existing inventory in the market.
  • In the more immediate future, roughly 7,200 units are expected to come online over the next four quarters, aligning annual deliveries closer to historical averages. On a submarket level, the core urban submarkets of The Loop, Streeterville / River North, and Evanston / Rogers Park will contribute to over 50% of the new units being added to the market. The remaining units under construction are relatively evenly distributed across suburban and outlying areas.

Occupancy & Rent Trends

RENT VS OWN
MONTHLY PAYMENT

$2,871

Average Monthly Mortgage Payment

$1,964

Average Monthly Rent

* The Average mortgage payment is based off a median home sales price of $362,100 as reported by NAR.

Occupancy trends

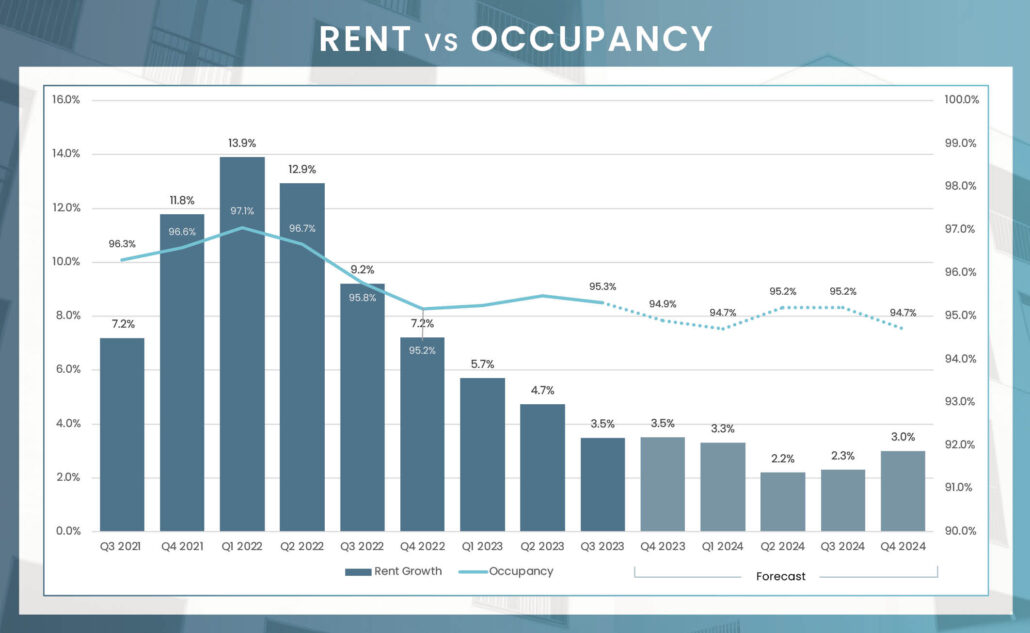
In Q2 2023, Chicago’s apartment operators and investors found reason for celebration as rental demand significantly rebounded during the crucial spring leasing season. The number of renters outstripped new unit deliveries by a sizable margin, driving the average occupancy rate up by 30 basis points from the Q1 figure to a healthy 95.5% in June. Of Chicago’s 20 submarkets, only three experienced quarterly declines in occupancy rates. In contrast, the upscale suburb of Naperville enjoyed a substantial 90 basis point increase over the first quarter figure, elevating the suburb’s average occupancy rate to 95.9%. Among the major urban submarkets, the Lincoln Park / Lakeview area maintained the highest occupancy rate at 96.5%. Breaking this down further, Class A, B, and C properties registered occupancy rates of 96.0%, 97.8%, and 99.4% respectively in this submarket.

A comparison of apartment product classes in Chicago reveals a relatively narrow divergence in occupancy rates. On the low end, Class A properties recorded an occupancy rate of 94.8% in the second quarter, while Class B properties registered at 96.2% on the high end. With only a 140-basis point difference separating these two product classes, the variation in occupancy rates is minimal. Delving further, Class B properties saw the largest quarterly increase in occupancy, rising 40 basis points to 95.4%. This uptick nudged the average occupancy rate for Class B communities just above its prior five-year average. Meanwhile, both Class A and C properties reported an occupancy increase of 10 basis points over the preceding quarter.

RENTAL TRENDS

Despite a slight moderation in rent growth during the second quarter, the broader Chicago apartment market continues to exhibit strong health. With annual rent growth measuring 4.8% in June, the rate remains significantly above both the prior five-year average and the long-term historical average in Chicago. In fact, this figure places Chicago as the seventh-highest market for rent growth in Q2 among the 50 largest apartment markets in the U.S. The Midwest was well-represented in the top ten, housing five of the leading 10 markets.

Analyzing product class performance within the Chicago market reveals that above-average rent growth was largely driven by Class B and C apartment communities, which registered annual growth rates of 5.9% and 5.8%, respectively. While Class C apartments didn’t witness the same double-digit rent growth in 2022 as its Class A and B counterparts, the Class C segment has seen a more modest decline from its peak rent growth holding steady at 5.8% as of June this year. In stark contrast, Class A communities, which stood at a peak of 17.9% just four quarters ago, have experienced a dramatic fall of 14.5 points, settling at an annual growth rate of 3.3% in the most recent quarter. It’s worth noting that the higher the rent goes, the farther it can potentially fall. However, the cooling down in Class A rents has been particularly marked.

Urban Submarket Rent & Occupancy

Urban SubmarketsAverage OccupancyAnnual Occupancy ChangeAverage Monthly RentAnnual Rent Change
The Loop94.2%-1.1%$2,5531.6%
Streeterville/River North95.3%-0.3%$2,8401.7%
Lincoln Park/Lakeview96.2%-0.5%$2,3474.1%
Evanston/Rogers Park/Uptown92.3%-3.0%$2,1464.1%
Bronzeville/Hyde Park/South Shore95.3%0.8%$1,6311.0%
South Cook County95.5%0.0%$1,3376.4%
Central Cook County94.5%0.1%$1,8704.4%
Weighted Average94.8%-0.5%$2,3162.6%

Suburban Submarket Rent & Occupancy

Suburban SubmarketsAverage OccupancyAnnual Occupancy ChangeAverage Monthly RentAnnual Rent Change
North Cook County95.0%-0.5%$1,8387.3%
Arlington Heights/Palatine/Wheeling95.2%-0.7%$1,8457.2%
Schaumburg96.3%-0.2%$1,7357.7%
North DuPage County95.8%-0.8%$1,5755.1%
Central DuPage County94.7%-0.6%$1,9173.8%
Southeast DuPage County95.5%0.2%$1,7524.7%
Naperville96.0%0.1%$1,8714.4%
Will County96.7%0.0%$1,6602.8%
Aurora94.8%-1.1%$1,8065.3%
Far Northwest Chicago Suburbs95.9%-0.4%$1,5764.3%
Lake County/Kenosha96.1%-0.2%$1,6222.1%
Gary/Hammond96.6%-1.6%$1,1703.1%
Merrillville/Portage/Valparaiso95.8%-0.8%$1,2841.8%
Weighted Average95.7%-0.4%$1,6944.6%

Units by Urban Submarket Delivering in 2023

7,443

Number of Units Under Construction

4,983

Number of Units Units UC Delivering In the Next 4 Quarters

Percentage of Units Under Construction

The Loop - 3,439
0%
Streeterville/River North - 1,716
0%
Lincoln Park/Lakeview - 444
0%
Evanston/Rogers Park/Uptown - 934
0%
Bronzeville/Hyde Park/South Shore - 128
0%
South Cook County - 151
0%
Central Cook County - 631
0%

Percentage of Units Delivering Next 4Q

The Loop - 1,809
0%
Streeterville/River North - 1,336
0%
Lincoln Park/Lakeview - 294
0%
Evanston/Rogers Park/Uptown - 786
0%
Bronzeville/Hyde Park/South Shore - 74
0%
South Cook County - 151
0%
Central Cook County - 533
0%

Units by Suburban Submarket Delivering in 2023

4,199

Number of Units Under Construction

2,132

Number of Units Units UC Delivering In the Next 4 Quarters

Percentage of Units Under Construction

North Cook County - 235
0%
Arlington Heights/Palatine/Wheeling - 76
0%
Schaumburg - 0
0%
North DuPage County - 293
0%
Central DuPage County - 286
0%
Southeast DuPage County - 70
0%
Naperville - 0
0%
Will County - 336
0%
Aurora - 618
0%
Far Northwest Chicago Suburbs - 1,060
0%
Lake County/Kenosha - 730
0%
Gary/Hammond - 100
0%
Merrillville/Portage/Valparaiso - 395
0%

Percentage of Units Delivering Next 4Q

North Cook County - 0
0%
Arlington Heights/Palatine/Wheeling - 76
0%
Schaumburg - 0
0%
North DuPage County - 146
0%
Central DuPage County - 200
0%
Southeast DuPage County - 70
0%
Naperville - 0
0%
Will County - 336
0%
Aurora - 327
0%
Far Northwest Chicago Suburbs - 496
0%
Lake County/Kenosha - 325
0%
Gary/Hammond - 66
0%
Merrillville/Portage/Valparaiso - 90
0%

Sales Activity

Downtown Chicago has reaffirmed its status as the metro area’s epicenter for multifamily transactions. Despite a noticeable dip of 35% in sales volume of single asset conventional multifamily properties during the first three quarters of 2023, the overall decline in transaction activity has been much less steep compared to nearly every other major market in the U.S. On average, U.S. multifamily volume has plummeted over 60% across the same timeframe. While institutional capital continues to have a foothold in Chicago, a significant majority of buyers have predominantly been private investors, attracted by the opportunities to acquire properties at reduced prices.

  1. FPA Multifamily
  2. Bayshore Properties
  3. JVM Realty Corp
  4. Pensam Capital
  5. F&F Realty Ltd
  1. Origin Investments
  2. Invesco Real Estate
  3. The Connor Group
  4. Broadshore Capital Partners
  5. Crescent Heights

*Most Active Buyers and Sellers are based on the sale volume of apartment units.

TRANSACTION VOLUME


YTD Transaction Volume


Y-O-Y Change


Individual Transaction Count


Price Per Unit


Annual Price Change

* Trailing 4Q average PPU

* Preliminary Data from RCA – Individual transaction $2.5M +

Economy

In August 2023, the Chicago Metro exhibited steady job growth, adding a substantial number of new positions across various sectors. The sectors demonstrating notable growth include Education and Health Services with an addition of 34,800 jobs (4.8% growth), and Leisure and Hospitality with 28,000 new jobs (5.9% growth). Other sectors like Government, Construction, and Financial Activities also experienced growth, adding 5,500 (1.1%), 2,800 (1.5%), and 2,800 (0.9%) jobs respectively. The region continues to show a significant addition of jobs in key sectors like Education, Health Services, and Leisure and Hospitality, reflecting the diverse economic landscape of the Chicago Metro. The figures indicate a promising economic scenario with steady job gains in several sectors.

50.2k

August Annual Jobs Created

1.1%

August 2023 Employment growth

5.1%

August 2023 Unemployment rate
3.8% us rate

Top 5 Employment Sector Annual Change

education & health services

Education & Health Services

Change from August 2022 to August 2023:
34,800

Percent Change:
4.8%

Leisure & Hospitality

Leisure & Hospitality

Change from May 2022 to May 2023:
28,000

Percent Change:
5.9%

government

Government

Change from May 2022 to May 2023:
5500

Percent Change:
1.1%

Construction

Construction

Change from May 2022 to May 2023:
2,800

Percent Change:
1.5%

Financial Activities

Financial Activities

Change from May 2022 to May 2023:
2,800

Percent Change:
0.9%

Hover over icons to view data
SectorChange from August 2022 to August 2023 Percent Change
Education and health services34,800 4.8%
Leisure and hospitality28,000 5.9%
Government5,500 1.1%
Construction2,800 1.5%
Financial activities2,800 0.9%
Other services1,300 0.7%
Manufacturing400 0.1%
Mining & logging100 6.7%
Information(5,000)-6.0%
Trade, transportation, and utilities(8,300)-0.9%
Professional and business services(12,200)-1.4%

Cost of Living Comparison

The cost-of-living index in Chicago, IL, is marked at 105.4, denoting a relatively moderate cost of living when compared to other major gateway markets. The housing index stands at 113.6, with a median home sales price of $362,600, reflecting a year-over-year change of -2.0%. The average mortgage payment in Chicago is $2,871, as opposed to the average rent which is priced at $1,964. Comparing the cost of living between Chicago, IL, and New York, NY, a substantial difference emerges. Chicago’s cost of living in various sectors is markedly lower. These comparative figures underscore Chicago’s economic appeal, especially for individuals or families looking to reside in a major urban center without the exceedingly high expenses associated with cities like New York. The lower cost of living across multiple sectors, particularly housing, presents a notable financial advantage, making Chicago an attractive alternative for a wide demographic spectrum seeking urban living with a moderated cost burden.

New York, NY vs. Chicago, IL
Cost of Living Comparison
Groceries:

13.6% Less
Housing:

70.3% Less
Utilities:

8.2% Less
Transportation:

0.5% Less
Health:

3.6% Less
Previous slide
Next slide
Cost of Living Index

105.4

Index Score

Average Mortgage

$2,871

vs Average Rent: $1,964

Housing

113.6

Index Score

Utilities

91

Index Score

Gas

109.4

Index Score

Median Home Sales Price

$362,600

YoY Change: -2.0%

The “Cost of Living” index score provides a comparative assessment of the relative expense involved in maintaining a standard of living in a specific area, benchmarked against a national index score of 100.

Market Outlook

The outlook for Chicago’s apartment market in the third quarter of 2023 remains cautiously optimistic, with a manageable pipeline of an estimated 7,100 units anticipated over the next four quarters. The city continues to benefit from a healthy job market, which as of August 2023, has seen steady job growth. Looking ahead, there’s a strong basis to believe that job growth will maintain its momentum in the metro area. Chicago’s stature as the Midwest’s capital and a key investment hub continues to draw significant multi-million-dollar initiatives, promising to fuel future job growth. Noteworthy are investments like Loop Capital Real Estate Partners’ $100 million venture in a South Cook County film studio, and The Chan Zuckerberg Initiative’s $250 million commitment to a biotech hub, both of which hold the potential to generate thousands of jobs independently. With such significant investments and the ongoing job creation across various sectors, the economic climate in Chicago is expected to remain favorable for the apartment market.

Sources: RealPage; BLS; MSCI; The Council for Community And Economic Research (C2ER)

To Gain Further Insights Into The Chicago Market Please Reach Out To Our local Team

Image of Kieth Cade

Keith Cade

Senior Director

Ryan Carter

Associate Advisor

Connor Hobbs

Associate

Have a question? Ask me here!