$1,685 4Q 2023
$1,751 4Q 2024
3.9%
95.1% 4Q 2023
94.9% 4Q 2024
-20 POINTS
4.77M 2023
4.79M 2024
4.2% 2023
4.5% 2024
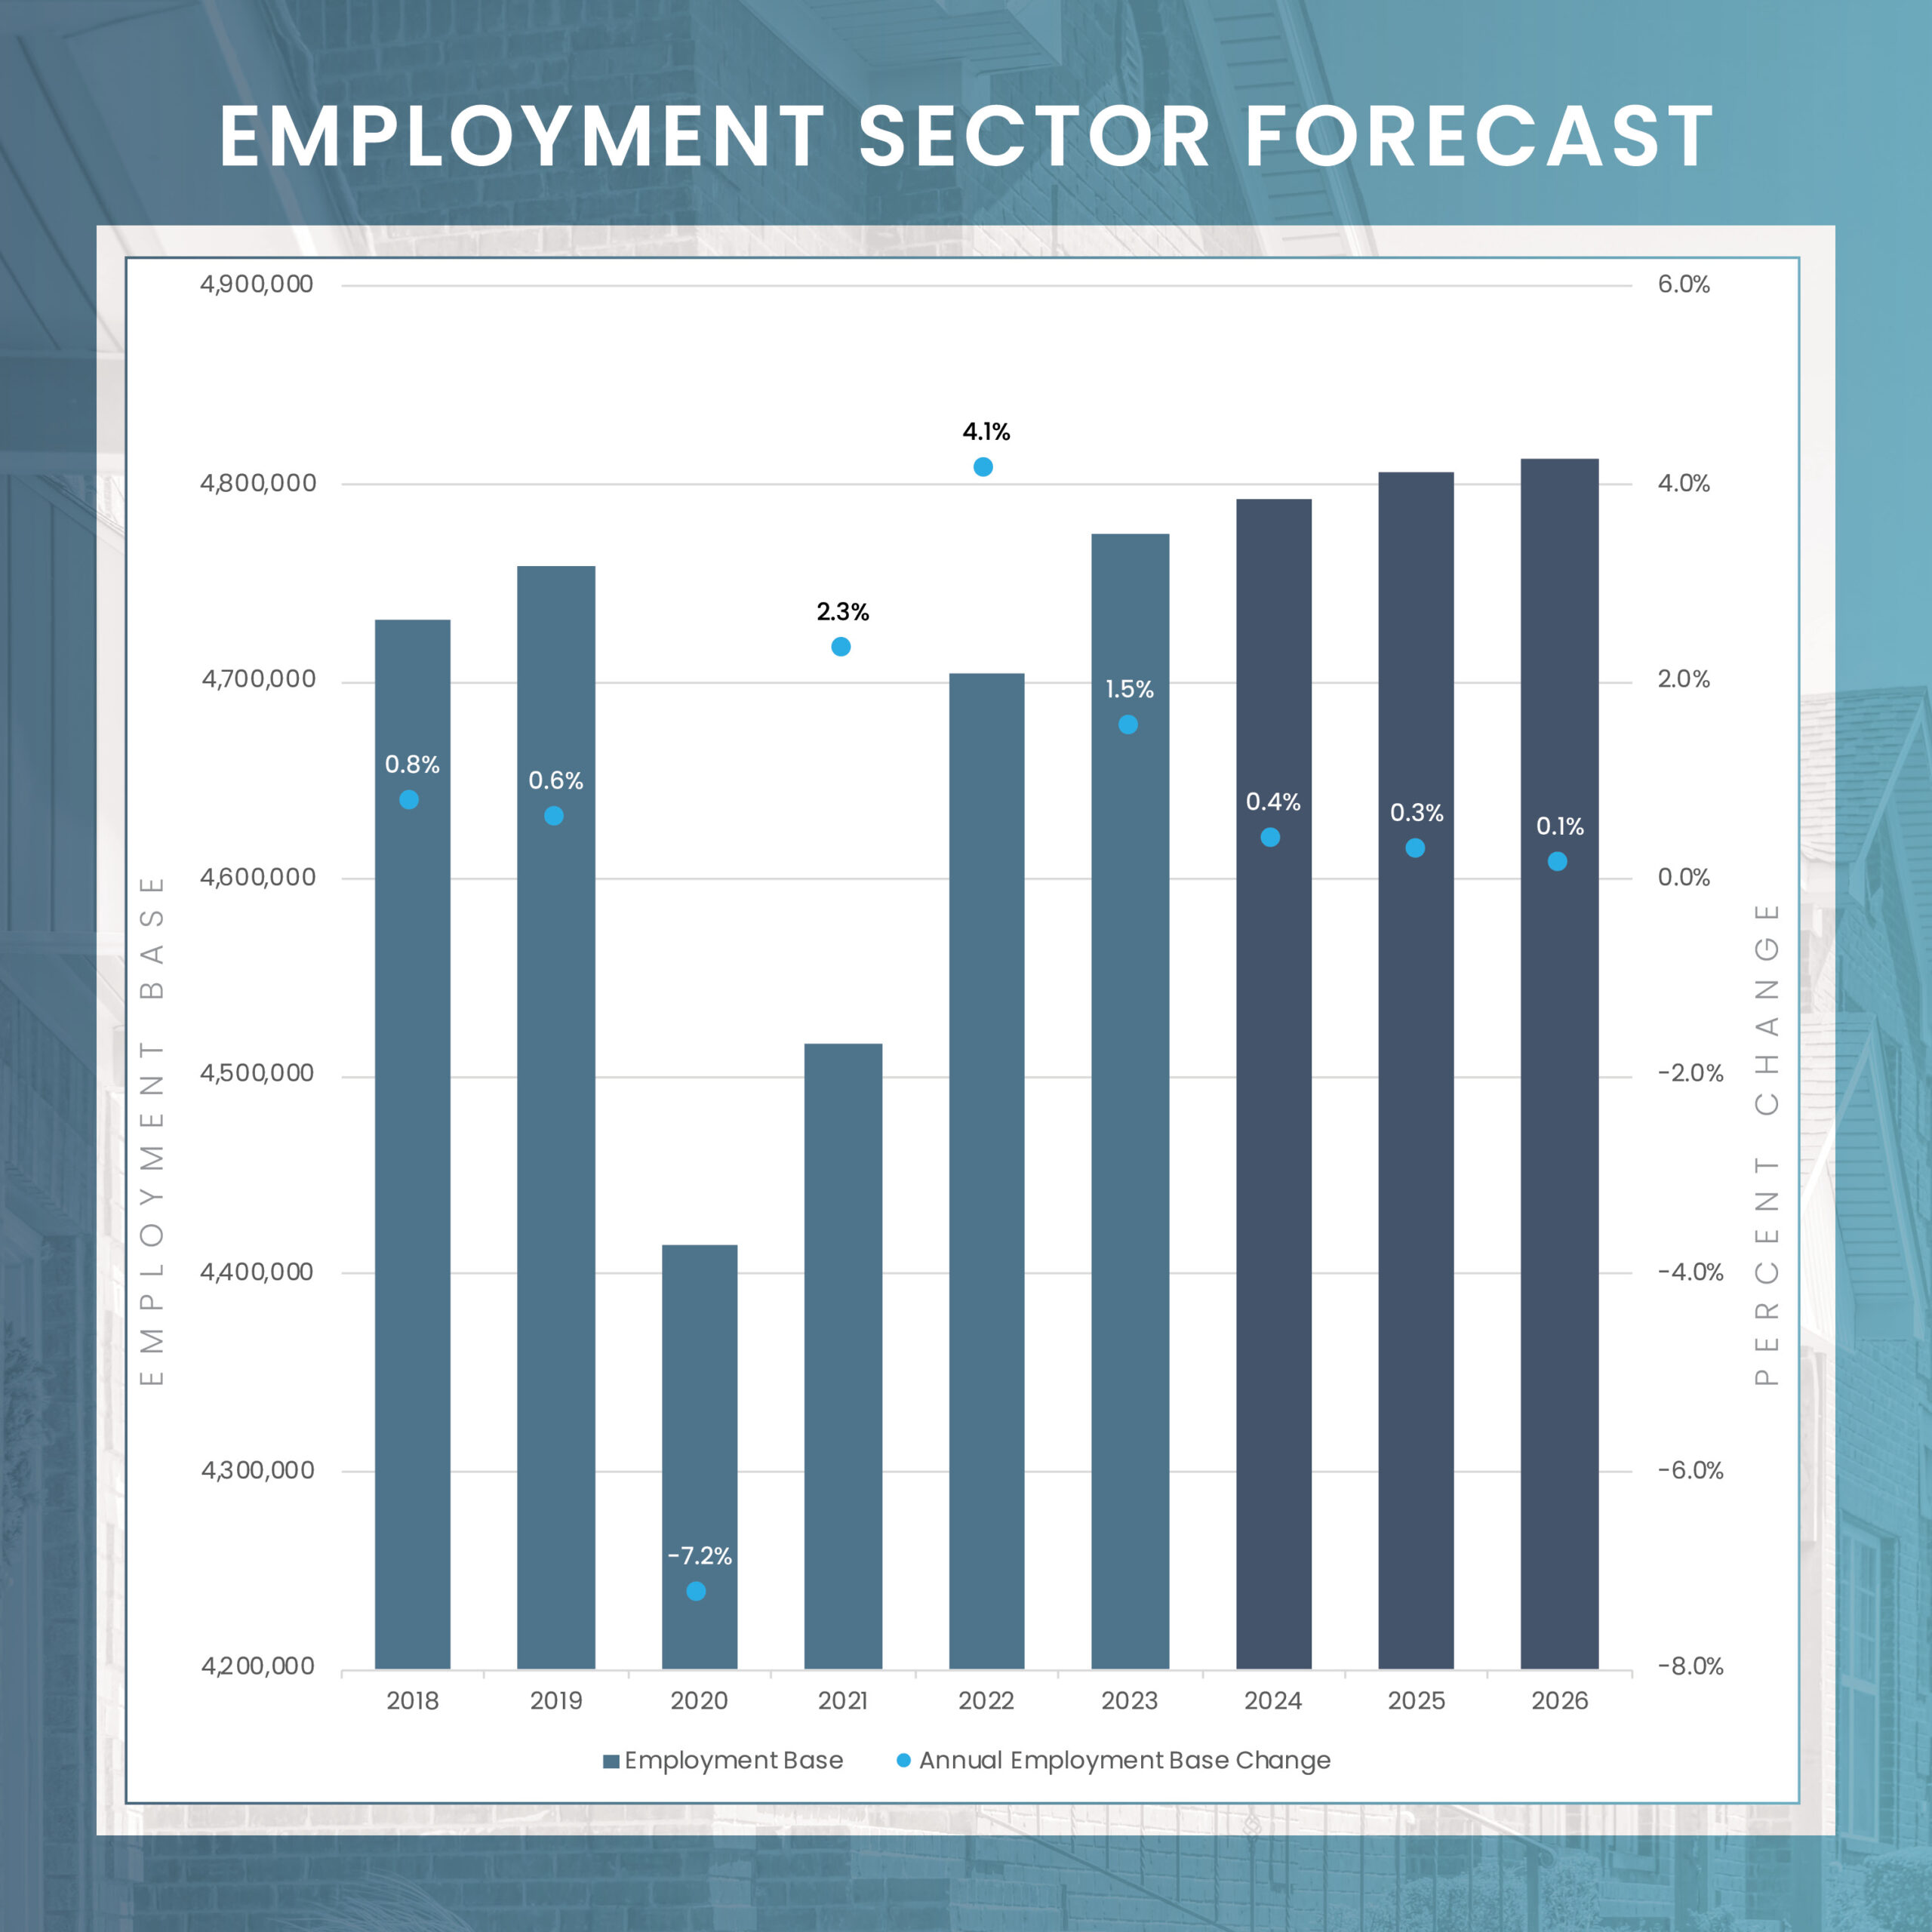
* Please note that these employment figures have been adjusted for seasonal variations and are based on Moody’s Analytics forecast as of January 1, 2024.
** Please note that these unemployment rates are estimates that have not been adjusted for seasonal variations, and they are derived from Moody’s Analytics forecast as of January 1, 2024.
FORECASTED ABSORPTION
FORECASTED NEW SUPPLY

One of the key positive aspects of Chicago’s multifamily market is how well occupancy is holding up. Over the past year, the city has seen an absorption of approximately 8,000 units, significantly exceeding its long-term net absorption average of 4,500 units. This performance is particularly commendable given the surge in development in recent years. The current occupancy rate stands at 95.1%, which aligns with the metro’s average and is impressive, especially in the context of the national average and the recent influx of new developments. The strongest submarkets in Chicago, Downtown and North Lakefront, have been pivotal in driving this growth. Combined, these areas account for nearly half of the metropolitan area’s year-over-year absorption gains, showcasing their dominance in the market.
Unlike other major multifamily markets such as Dallas, Phoenix, and Miami, Chicago has exhibited a more stable pattern of new supply expansion over the past five years. As a prominent gateway market, Chicago simultaneously presents characteristics typical of traditional Midwest apartment markets, a combination that sets it apart in the national context. One key factor contributing to this stability is Chicago’s current construction pipeline, which represents only 2.0% of its existing inventory. This relatively modest pipeline is largely a result of the city’s lengthy development approval processes. Such regulatory environments have effectively tempered supply spikes in Chicago, allowing demand to keep pace with and efficiently absorb new units, a dynamic not always observed in markets with more aggressive construction activities.
Looking ahead, the forecast for the next four quarters indicates a continuation of this trend. Approximately 7,000 units are expected to be added, which is consistent with the historical average for the region. The concentration of construction activity is notable in Downtown Chicago, which accounts for 36% of the entire market-wide pipeline. This focus on Downtown underscores its importance as a key area of development. Additionally, there is significant construction activity near mass transit stations in suburban areas, including East Suburban McHenry, North Lakefront, North DuPage County, and Northwest Chicago. These submarkets collectively are expected to contribute to half of all upcoming completions in the next 12 months.
Average Monthly Mortgage Payment
Average Monthly Rent
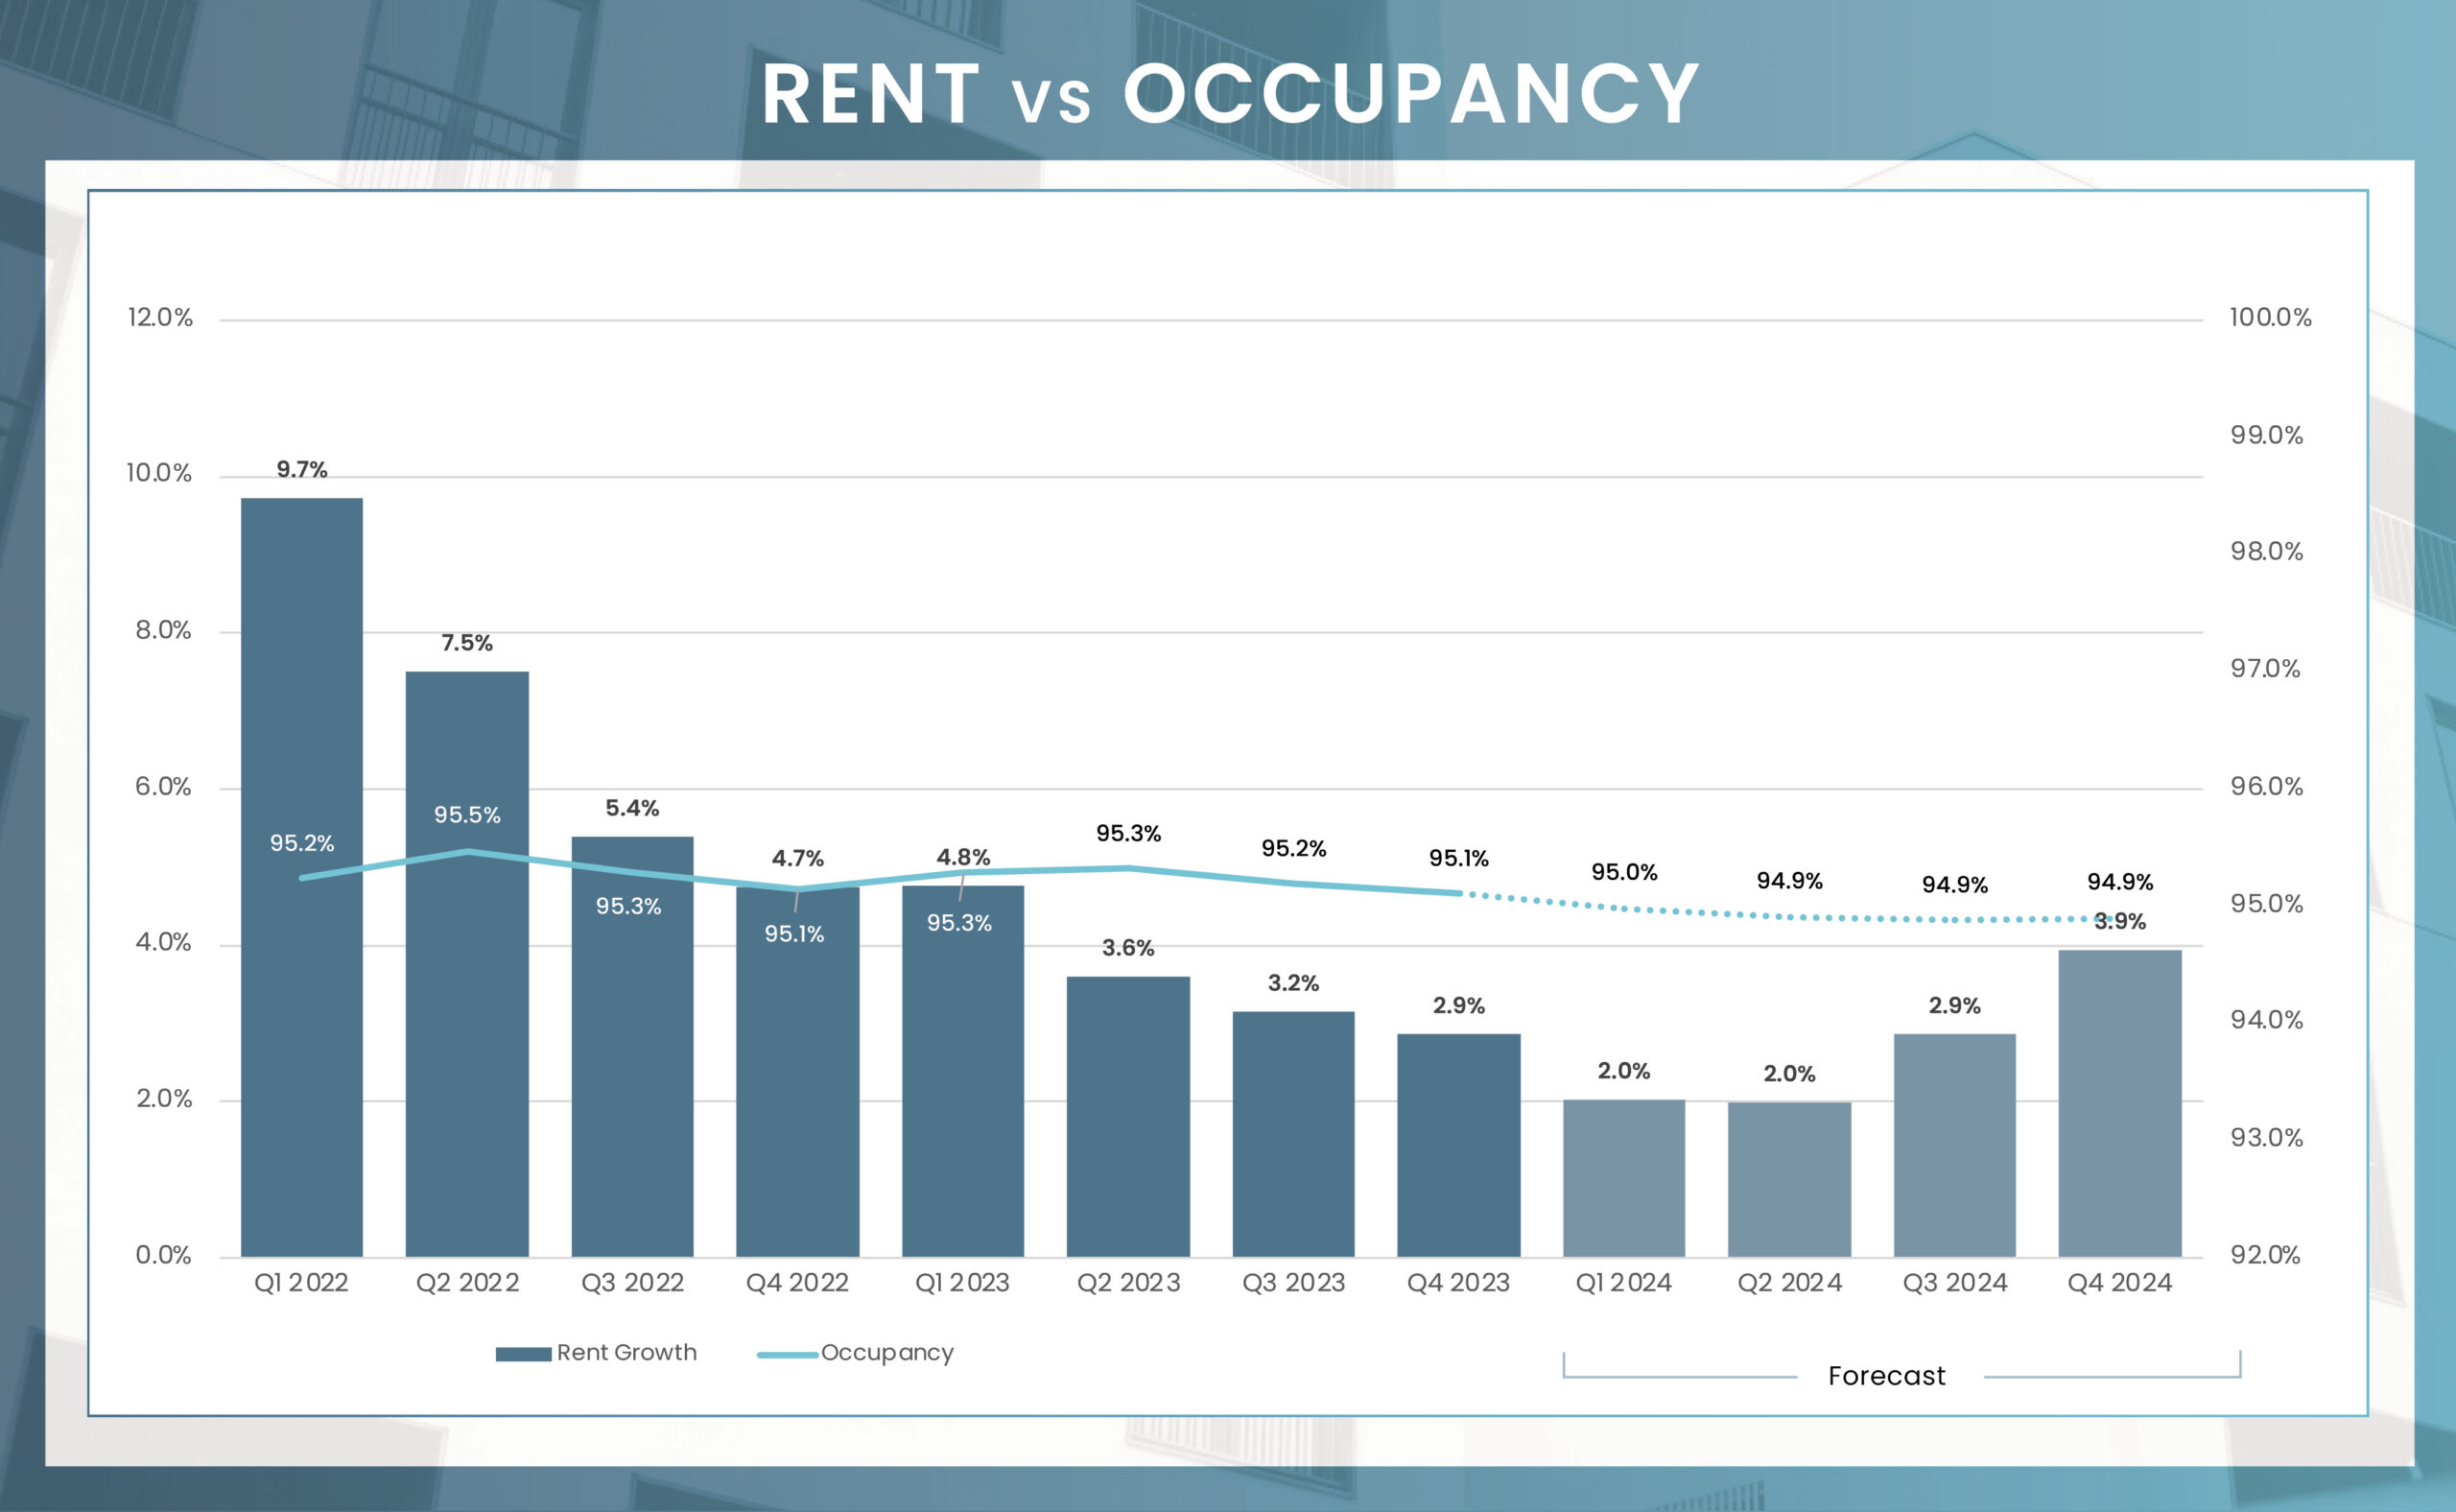
In the past year, Chicago’s multifamily market has seen varied rent growth across its 42 submarkets. Regions with limited construction, like Kendall County, achieved a 6.6% rent increase. Conversely, urban submarkets collectively grew by only 1.8%, with Downtown Chicago holding a significant portion of the multifamily supply, recording a mere 0.4% increase due to a surplus of high-grade units.
Looking ahead to 2024, rent growth in Chicago is anticipated to be led by neighborhoods and cities with minimal new development. Aurora, for example, with scant development in the pipeline, is projected to see a notable 4.4% rent growth by the year’s end. Last year, the dense urban submarkets of Chicago experienced only modest growth, but a more balanced influx of new deliveries is expected to boost rent growth in these areas. Downtown Chicago, for instance, is forecasted to achieve a 3.8% rent increase by year-end, while the North Lakefront submarket, including Lincoln Park, is poised for a 4.0% annual growth. Overall, the Chicago apartment market is set to witness a 3.9% increase in rents by the end of 2024, with all submarkets expecting positive growth in the range of 3.2% to 4.5%. This uniform growth across both urban and suburban areas underlines the stability of Chicago’s multifamily market.
| Submarket | Q4 2023 Stabilized Occupancy | Q4 2024 Stabilized Occupancy (f) | Annual Occupancy Change (2024/2023) | Q4 2023 Average Monthly Rent | Q4 2024 Average Monthly Rent (f) | Annual Rent Change (2024/2023) |
|---|---|---|---|---|---|---|
| South Will County | 94.0% | 93.7% | -0.3% | $1,033 | $1,080 | 4.5% |
| Aurora | 97.2% | 97.0% | -0.2% | $1,287 | $1,343 | 4.4% |
| Southwest Lake County | 96.5% | 96.4% | -0.1% | $1,893 | $1,975 | 4.3% |
| Kenosha | 96.5% | 96.3% | -0.2% | $1,288 | $1,343 | 4.3% |
| Northeast DuPage County | 94.9% | 94.8% | -0.2% | $1,847 | $1,926 | 4.2% |
| DeKalb County | 97.1% | 96.9% | -0.2% | $732 | $763 | 4.2% |
| Near North Suburban Cook | 96.2% | 96.0% | -0.2% | $1,725 | $1,798 | 4.2% |
| Far Northwest Suburban Cook | 95.5% | 95.4% | -0.2% | $1,653 | $1,722 | 4.2% |
| Southwest Chicago | 93.5% | 93.1% | -0.4% | $1,032 | $1,075 | 4.2% |
| West Cook | 96.1% | 95.9% | -0.2% | $1,339 | $1,394 | 4.2% |
| Glen Ellyn to West Chicago Corridor | 96.3% | 96.1% | -0.1% | $1,631 | $1,698 | 4.2% |
| Porter County | 97.1% | 96.9% | -0.2% | $1,213 | $1,263 | 4.1% |
| Southeast DuPage County | 95.4% | 95.3% | -0.2% | $1,655 | $1,724 | 4.1% |
| Grundy County | 98.0% | 97.9% | -0.2% | $1,061 | $1,105 | 4.1% |
| Far North Chicago | 95.5% | 95.2% | -0.3% | $1,219 | $1,269 | 4.1% |
| South Lakefront | 93.5% | 93.2% | -0.3% | $1,296 | $1,349 | 4.1% |
| Western McHenry County | 96.7% | 96.5% | -0.2% | $1,133 | $1,179 | 4.1% |
| Far North Suburban Cook | 94.3% | 94.1% | -0.2% | $2,314 | $2,408 | 4.0% |
| DeKalb | 93.1% | 92.8% | -0.4% | $960 | $999 | 4.0% |
| Evanston | 95.5% | 95.3% | -0.2% | $2,053 | $2,136 | 4.0% |
| North DuPage County | 96.9% | 96.8% | -0.1% | $1,607 | $1,671 | 4.0% |
| North Lake County IN | 93.7% | 93.4% | -0.3% | $1,131 | $1,176 | 4.0% |
| Southeast Lake County | 94.4% | 94.2% | -0.2% | $2,322 | $2,414 | 4.0% |
| Northwest Chicago | 95.4% | 95.2% | -0.3% | $1,249 | $1,299 | 4.0% |
| North Lakefront | 95.2% | 95.0% | -0.2% | $1,886 | $1,961 | 4.0% |
| Southern Cook County | 95.0% | 94.7% | -0.3% | $1,112 | $1,156 | 3.9% |
| Northwest Lake County | 96.2% | 96.0% | -0.2% | $1,370 | $1,423 | 3.9% |
| Des Plaines/Arlington Hts Corridor | 95.5% | 95.4% | -0.2% | $1,728 | $1,796 | 3.9% |
| North Will County | 96.1% | 96.0% | -0.2% | $1,641 | $1,705 | 3.9% |
| Elgin/Dundee | 97.1% | 96.9% | -0.1% | $1,587 | $1,648 | 3.9% |
| Northeast Lake County | 96.6% | 96.4% | -0.2% | $1,216 | $1,263 | 3.8% |
| Southwest Cook County | 95.6% | 95.4% | -0.3% | $1,342 | $1,393 | 3.8% |
| Fox River Valley | 94.4% | 94.2% | -0.2% | $1,837 | $1,907 | 3.8% |
| Downtown Chicago | 94.0% | 93.9% | -0.1% | $2,646 | $2,746 | 3.8% |
| University Park | 93.0% | 92.7% | -0.3% | $1,217 | $1,262 | 3.7% |
| East Suburban McHenry | 98.3% | 98.2% | -0.1% | $1,486 | $1,541 | 3.7% |
| South Lake County IN | 92.7% | 92.4% | -0.4% | $1,247 | $1,293 | 3.6% |
| Western Kane County | 98.4% | 98.3% | -0.1% | $2,201 | $2,281 | 3.6% |
| Kendall County | 96.7% | 96.2% | -0.5% | $1,904 | $1,972 | 3.6% |
| Naperville/Lisle | 95.7% | 95.6% | -0.1% | $1,752 | $1,814 | 3.5% |
| South Chicago | 94.7% | 94.5% | -0.3% | $1,125 | $1,161 | 3.2% |
| Market | 95.1% | 94.9% | -0.2% | $1,685 | $1,751 | 3.9% |
3Q 2023 Unit Inventory
Number of Units Under Construction
Number of Units UC Delivering
In the Next 4 Quarters
| Submarket | Unit Inventory: 4Q 2023 | Units Under Construction | % of Existing Inventory UC | % of Total UC | Units UC Delivering In the Next 4 Quarters |
|---|---|---|---|---|---|
| Downtown Chicago | 58,924 | 4,053 | 7% | 36.3% | 853 |
| North Lakefront | 90,328 | 0 | 0% | 0.0% | 716 |
| East Suburban McHenry | 3,494 | 639 | 18% | 5.7% | 638 |
| Northwest Chicago | 23,933 | 873 | 4% | 7.8% | 620 |
| North DuPage County | 7,215 | 613 | 8% | 5.5% | 611 |
| Kendall County | 2,995 | 655 | 22% | 5.9% | 551 |
| Northeast DuPage County | 13,696 | 548 | 4% | 4.9% | 544 |
| Kenosha | 10,307 | 474 | 5% | 4.2% | 334 |
| North Will County | 10,875 | 728 | 7% | 6.5% | 293 |
| Far Northwest Suburban Cook | 19,365 | 296 | 2% | 2.6% | 291 |
| South Lake County IN | 6,504 | 545 | 8% | 4.9% | 273 |
| Southwest Chicago | 27,614 | 220 | 1% | 2.0% | 186 |
| Des Plaines/Arlington Hts Corridor | 19,873 | 267 | 1% | 2.4% | 174 |
| Southwest Cook County | 13,767 | 176 | 1% | 1.6% | 173 |
| West Cook | 25,685 | 158 | 1% | 1.4% | 152 |
| Northeast Lake County | 11,925 | 139 | 1% | 1.2% | 136 |
| South Lakefront | 44,571 | 58 | 0% | 0.5% | 128 |
| Evanston | 8,634 | 120 | 1% | 1.1% | 118 |
| Far North Chicago | 34,384 | 89 | 0% | 0.8% | 81 |
| DeKalb | 5,977 | 65 | 1% | 0.6% | 63 |
| Porter County | 7,188 | 28 | 0% | 0.3% | 26 |
| Glen Ellyn to West Chicago Corridor | 10,103 | 104 | 1% | 0.9% | 15 |
| Aurora | 4,840 | 14 | 0% | 0.1% | 12 |
| DeKalb County | 151 | 0 | 0% | 0.0% | 0 |
| Elgin/Dundee | 5,484 | 0 | 0% | 0.0% | 0 |
| Far North Suburban Cook | 3,291 | 0 | 0% | 0.0% | 0 |
| Fox River Valley | 4,156 | 0 | 0% | 0.0% | 0 |
| Grundy County | 668 | 0 | 0% | 0.0% | 0 |
| Naperville/Lisle | 20,589 | 0 | 0% | 0.0% | 0 |
| Near North Suburban Cook | 7,770 | 0 | 0% | 0.0% | 0 |
| North Lake County IN | 10,004 | 0 | 0% | 0.0% | 0 |
| Northwest Lake County | 3,790 | 0 | 0% | 0.0% | 0 |
| South Chicago | 3,230 | 0 | 0% | 0.0% | 0 |
| South Will County | 550 | 0 | 0% | 0.0% | 0 |
| Southeast DuPage County | 7,437 | 22 | 0% | 0.2% | 0 |
| Southeast Lake County | 3,469 | 0 | 0% | 0.0% | 0 |
| Southern Cook County | 10,913 | 0 | 0% | 0.0% | 0 |
| Southwest Lake County | 5,161 | 295 | 6% | 2.6% | 0 |
| University Park | 1,858 | 0 | 0% | 0.0% | 0 |
| Western Kane County | 369 | 0 | 0% | 0.0% | 0 |
| Western McHenry County | 2,449 | 0 | 0% | 0.0% | 0 |
| Market | 553,536 | 11,179 | 2.0% | 100.0% | 6,988 |
In 2023, the Chicago multifamily market recorded $2.8 billion in investment activity through 131 transactions, a 19% decline from the previous year. Although a decrease in transaction activity isn’t typically positive, this 19% drop was relatively modest compared to broader trends in 2023. For context, transaction activity in the U.S. multifamily sector fell by approximately 65% over the same period. When compared to other property types within the Chicago metro area, residential investment fared the best. Between the first quarter of 2023 and the first quarter of 2024, office sales in Chicago plummeted by 72%, retail investments declined by 49%, and industrial sales decreased by 61%.
This performance suggests that, despite prevailing market uncertainties and significant bid-ask spread challenges, Chicago’s multifamily market inherently offers some degree of protection for commercial real estate (CRE) investors. Factors contributing to this resilience include Chicago’s status as a major gateway market, its relative affordability, and its position as the third-largest city in the United States. These characteristics seem to provide a buffer for the multifamily sector, maintaining its appeal to investors even in a fluctuating economic landscape.
* Trailing 4Q average PPU
* Preliminary Data from RCA – Individual transaction $2.5M +
P = Preliminary
| Sector | Employment Change 2023 to 2024 | Percent Change |
|---|---|---|
| Overall Employment | 17,800 | 0.4% |
| Manufacturing | 300 | 0.1% |
| Construction | 600 | 0.3% |
| Trade, Transport., & Utilities | 1,200 | 0.1% |
| Information | (1,200) | -1.5% |
| Financial Activities | 1,500 | 0.5% |
| Professional & Business Services | (2,300) | -0.3% |
| Education & Health Services | 12,100 | 1.6% |
| Government | 2,200 | 0.4% |
| Leisure & Hospitality | 3,300 | 0.7% |
| Natural Resources & Mining | 200 | 12.5% |
| Other Services | (300) | -0.2% |
The outlook for Chicago’s apartment market in the upcoming year is one of stabilization, underpinned by robust job growth. The Bureau of Labor Statistics anticipates the creation of 17,800 new jobs in 2024, a development that is expected to boost household formation and sustain the demand for housing in the area. As the impact of the pandemic recedes and a greater number of workers transition back to office environments, downtown residential sectors are likely to see a significant uptick in demand and activity. This resurgence will not be limited to the central areas but is also expected to spread to the surrounding neighborhoods.
In addition to the general economic recovery, specific large-scale investments are set to further enhance Chicago’s economic landscape. Notable among these is Loop Capital Real Estate Partners’ ambitious project—a $100 million film studio in South Cook County. Similarly, The Chan Zuckerberg Initiative’s investment of $250 million in a biotech hub is poised to generate thousands of new jobs. These significant injections of capital and the subsequent job creation are promising for the apartment market in Chicago. They indicate a strengthening of the city’s economic foundation, which in turn is likely to have a positive ripple effect on the housing demand, particularly in the apartment sector. This confluence of job growth and strategic investments points towards a period of growth and stability for the Chicago apartment market in the near future.