Charlotte 2Q23
Multifamily Market Report

$1,602

average rent

93.7%

average occupancy rate

$905.5M

ytd sales volume

-1.3%

YoY rent change

-1.2 POINTS

yoy occupancy change

19 YTD

individual transactions

Supply & Demand

3Q23

3,429 Units

QUARTERLY DEMAND
YTD: 8,380

3,956 Units

QUARTERLY COMPLETIONS
YTD: 10,285

Annual Demand vs Completions

2018
7,951
8,005
2019
8,551
8,200
2020
7,410
7,238
2021
11,793
9,347
2022
293
7,154
2023 YTD
8,380
10,285
  • Planned.png
    Completions
  • Pre-Planned.png
    Demand

Demand Trends

  • Charlotte’s apartment market experienced significant momentum in Q3 2023, highlighted by a net absorption of over 3,400 units, painting a promising picture of the market’s trajectory.
  • All 15 of Charlotte’s submarkets demonstrated positive net absorption in the same quarter. Notably, the UNC Charlotte region led the way, contributing to the surge with a net absorption of 911 units.

Completion Trends

  • The third quarter of 2023 saw a significant increase in Charlotte’s apartment inventory, adding 3,956 new units to the local market.
  • Over the past year, the UNC Charlotte submarket has emerged as a hotspot for apartment completions. New units in this area accounted for 22% of Charlotte’s total new apartment offering over the past year.

Demand Outlook

  • Looking forward to 2024, the outlook for Charlotte’s apartment market remains optimistic. Demand is projected to gain further momentum, with an expected annual absorption rate of 22,348 units over the coming four quarters.
  • Southwest Charlotte is an area to watch, as it is forecasted to account for 19.5% of the total absorption in the next twelve months.

New Supply Outlook

  • Developers are anticipated to deliver over 21,000 units over the next four quarters across the Charlotte apartment market.
  • Southwest Charlotte is expected to be at the forefront of these additions, with an estimated 4,391 units set to deliver in one year’s time.

Occupancy & Rent Trends

RENT VS OWN
MONTHLY PAYMENT

$2,998

Average Monthly Mortgage Payment

$1,602

Average Monthly Rent

Occupancy trends

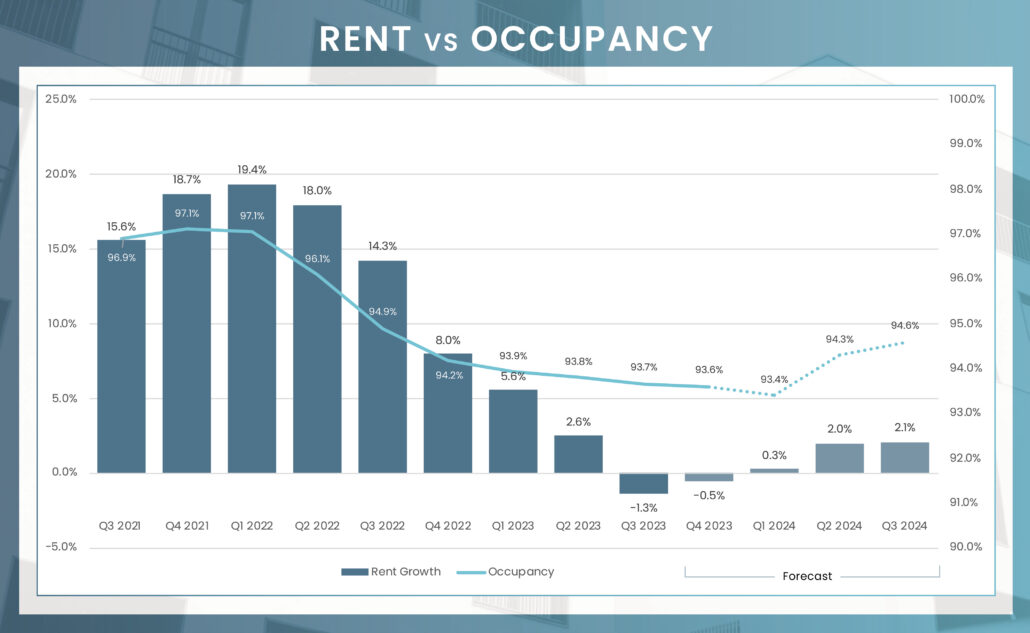
The Charlotte apartment market experienced a slight decline in occupancy during Q3 2023, settling at 93.7%—a year-on-year decrease of 120 basis points. When analyzed by class, Class C establishments led the way with the highest occupancy rate, recorded at 94.1%. Close on their heels were Class A and Class B units, registering occupancy rates of 93.8% and 93.4%, respectively. On a submarket level, Gaston County outperformed, recording an occupancy rate of 95.0%, while South Charlotte trailed with a rate of 92.9%. Looking forward, occupancy rates in the Charlotte area are projected to hover around the 94% threshold in the forthcoming year, signaling a stable market trend.

RENTAL TRENDS

During Q2 2023, monthly rents in the Charlotte apartment market experienced a modest decline of 1.3% compared to the previous year, settling at an average of $1,602. Traditionally, Class B units have been the key drivers of rent fluctuations. However, Q3 2023 saw rent adjustments affecting all apartment categories, attributed to shifting market dynamics. Specifically, Class A units recorded a 1.6% decrease, Class B units saw a 1.2% dip, and Class C units aligned with the broader market trend, also declining by 1.3%. At the submarket level, East Charlotte emerged as an exception, registering a 2.2% annual increase in rents. Conversely, South Charlotte and the Mooresville/Statesville area lagged, posting declines of 3.7% and 3.3%, respectively. Looking ahead, projections for the Charlotte region indicate that rental growth is expected to stabilize around 2.1% by the end of 2024.

Submarket Rent & Occupancy

SubmarketAverage OccupancyAnnual Occupancy ChangeAverage Monthly RentAnnual Rent Change
Uptown/South End93.6%-0.9%$2,098-2.9%
Myers Park94.1%-0.8%$1,8190.6%
Southwest Charlotte93.5%-1.5%$1,567-1.9%
North Charlotte93.2%-1.0%$1,5490.2%
UNC Charlotte93.4%0.2%$1,503-1.4%
East Charlotte94.1%-1.7%$1,4022.2%
Far East Charlotte/Mint Hill93.8%-1.2%$1,3241.2%
Matthews/Southeast Charlotte93.9%-1.6%$1,5840.3%
South Charlotte92.9%-1.3%$1,501-3.7%
Ballantyne94.1%-0.5%$1,827-1.7%
Rock Hill/Fort Mill93.7%-2.3%$1,546-2.6%
Gaston County95.0%-2.0%$1,4120.5%
Huntersville/Cornelius93.6%-2.2%$1,659-2.2%
Mooresville/Statesville93.8%-0.5%$1,450-3.3%
Concord/Kannapolis/Salisbury93.8%-1.7%$1,467-1.9%
Charlotte-Concord-Gastonia, NC-SC93.7%-1.2%$1,602-1.3%

Units by Submarket Delivering in 2023

35,192

Units Under Construction

21,495

Units UC Delivering In the Next 4 Quarters

Units Under Construction

Ballantyne - 695
0%
Concord/Kannapolis/Salisbury - 1,809
0%
East Charlotte - 1,439
0%
Far East Charlotte/Mint Hill - 445
0%
Gaston County - 692
0%
Hunterville/Cornelius - 1,997
0%
Matthews/Southeast Charlotte - 674
0%
Mooresville/Statesville - 1,413
0%
Myers Park - 1,708
0%
North Charlotte - 5,792
0%
Rock Hill/Fort Mill - 1,269
0%
South Charlotte - 239
0%
Southwest Charlotte - 8,151
0%
UNC Charlotte - 3,639
0%
Uptown/South End - 4,965
0%

Units Delivering Next 4Q

Ballantyne - 305
0%
Concord/Kannapolis/Salisbury - 1,160
0%
East Charlotte - 1,291
0%
Far East Charlotte/Mint Hill - 445
0%
Gaston County - 692
0%
Hunterville/Cornelius - 792
0%
Matthews/Southeast Charlotte - 141
0%
Mooresville/Statesville - 834
0%
Myers Park - 972
0%
North Charlotte - 4,064
0%
Rock Hill/Fort Mill - 600
0%
South Charlotte - 0
0%
Southwest Charlotte - 4,391
0%
UNC Charlotte - 2,124
0%
Uptown/South End - 3,684
0%

Sales Activity

By 3Q 2023, the apartment market in Charlotte, NC experienced a deceleration in trading activity. MSCI Real Capital Analytics data reveals that 19 single-asset conventional multifamily properties exchanged hands, translating to a total transaction volume of $905.5 million. This represents a sharp drop of 73% compared to the same timeframe in the prior year. However, there’s a silver lining: the average unit transaction price displayed an uptick of 13.2%, landing at $272,500, surpassing average prices in the broader southern region. While transaction volume has waned compared to past years, Charlotte’s robust economic underpinnings continue to make it a magnet for investors. The metro’s market prospects shine brightly, and its inherent growth capabilities are set to maintain investor appeal in the foreseeable future.

  1. GV&A RE Investments
  2. MAA REIT
  3. Southwood Realty/Triangle
  4. AMAC Holdings
  5. Bell Partners
  1. Crescent Communities
  2. Greystar
  3. Starwood Capital
  4. RangeWater RE
  5. Alliance Residential

TRANSACTION VOLUME


YTD Transaction Volume

Y-O-Y Change

Individual Transaction Count

Price Per Unit

Annual Price Change

* Trailing 4Q average PPU

* Preliminary Data from RCA – Individual transaction $2.5M +

Economy

In August 2023, Charlotte, NC showcased an impressive employment trajectory, adding a remarkable 49,300 jobs over the year—a significant 3.7% surge from August 2022. This positive trend drove the unemployment rate down by 0.6 percentage points year-on-year, settling at a commendable 3.3%, which undercuts the national average of 3.9%. Sector-wise, leisure and hospitality emerged as a powerhouse, adding a stellar 18,900 roles, translating to a 13.1% growth. Not far behind, the Professional and Business Services sector expanded by 2.3%, welcoming 5,200 new job opportunities. These upbeat figures underscore Charlotte’s dynamic economic vitality and promising employment landscape.

49.3k

August Annual Jobs Created

3.7%

Augsut 23 Employment growth

3.3%

August 23 Unemployment rate
3.9% us August rate

Top 5 Employment Sector Annual Change

leisure & hospitality

leisure & hospitality

Change from August 2022 to August 2023:
18,900

Percent Change:
13.1%

professional & business services

professional & business services

Change from August 2022 to August 2023:
5,200

Percent Change:
2.3%

government

government

Change from August 2022 to August 2023:
5,200

Percent Change:
3.4%

trade, transportation & utilities

trade, transportation & utilities

Change from August 2022 to August 2023:
4,300

Percent Change:
1.6%

financial activities

financial activities

Change from August 2022 to August 2023:
4,100

Percent Change:
3.4%

Hover over icons to view data
Tap icons to view data
SectorChange from August 2022 to August 2023 Percent Change
Leisure and hospitality18,900 13.1%
Professional and business services5,200 2.3%
Government5,200 3.4%
Trade, transportation, and utilities4,300 1.6%
Financial activities4,100 3.4%
Education and health services2,900 6.3%
Mining, logging, and construction2,400 3.2%
Other services1,500 3.1%
Information400 1.5%
Manufacturing(2,200)-2.0%

Cost of Living Comparison

When comparing the cost of living between Nashville, TN, and Charlotte, NC, key differences surface that may inform residential and investment decisions. With a Cost-of-Living index of 97.5, Charlotte generally offers a more affordable standard of living relative to the national average. While Charlotte slightly surpasses Nashville in transportation costs and is notably more expensive in healthcare—with a 2.6% increase—housing and utilities in Charlotte provide substantial savings, being 17.8% and 4.6% lower than in Nashville, respectively. These factors make Charlotte an increasingly appealing option for young professionals seeking a cost-effective, yet dynamic, environment in the Southeast.

Nashville, TN vs. Charlotte, NC
Cost of Living Comparison
Groceries:

0.1% Less
Housing:

17.8% Less
Utilities:

4.6% Less
Transportation:

1.5% More
Health:

2.6% More
Previous slide
Next slide
Cost of Living Index

97.5

Index Score

Average Mortgage

$2,998

vs Average Rent: $1,602

Housing

88.4

Index Score

Utilities

90.1

Index Score

Gas

93.5

Index Score

Median Home Sales Price

$403,100

YoY Change: -2.7%

Market Outlook

As of Q3 2023, Charlotte’s multifamily market was particularly vibrant in terms of development, boasting 35,192 apartment units under construction. This volume marks a peak in multifamily development for the Charlotte area, yet demand is anticipated to align closely with the increased supply projected for the next four quarters. This construction boom, when viewed alongside a favorable demand forecast, robust economic indicators, and Charlotte’s growing allure for transplants from the Northeast, establishes a solid groundwork for market stability. Given these conditions, rent growth is projected to shift into positive territory in 2024 and is expected to align with historical performance by 2025. This outlook underscores a balanced market where robust demand effectively corresponds with the abundant supply.

Sources: RealPage; BLS; MSCI; The Council for Community And Economic Research (C2ER)

To Gain Further Insights Into The CHARLOTTE Market Please Reach Out To Our Team

Image of Alex

Alex Blagojevich

Executive Managing Director & Founding Partner

Image of Michael Sullivan

Michael Sullivan

Executive Managing Director & Founding Partner

Image of David

David Huey

Senior Director

Kendall Adams

Associate Advisor

Ryan Carter

Associate Advisor