average rent
average occupancy rate
ytd sales volume
YoY rent change
yoy occupancy change
individual transactions
QUARTERLY DEMAND
YTD: 548
QUARTERLY COMPLETIONS
YTD: 1,257


Average Monthly Mortgage Payment
Average Monthly Rent
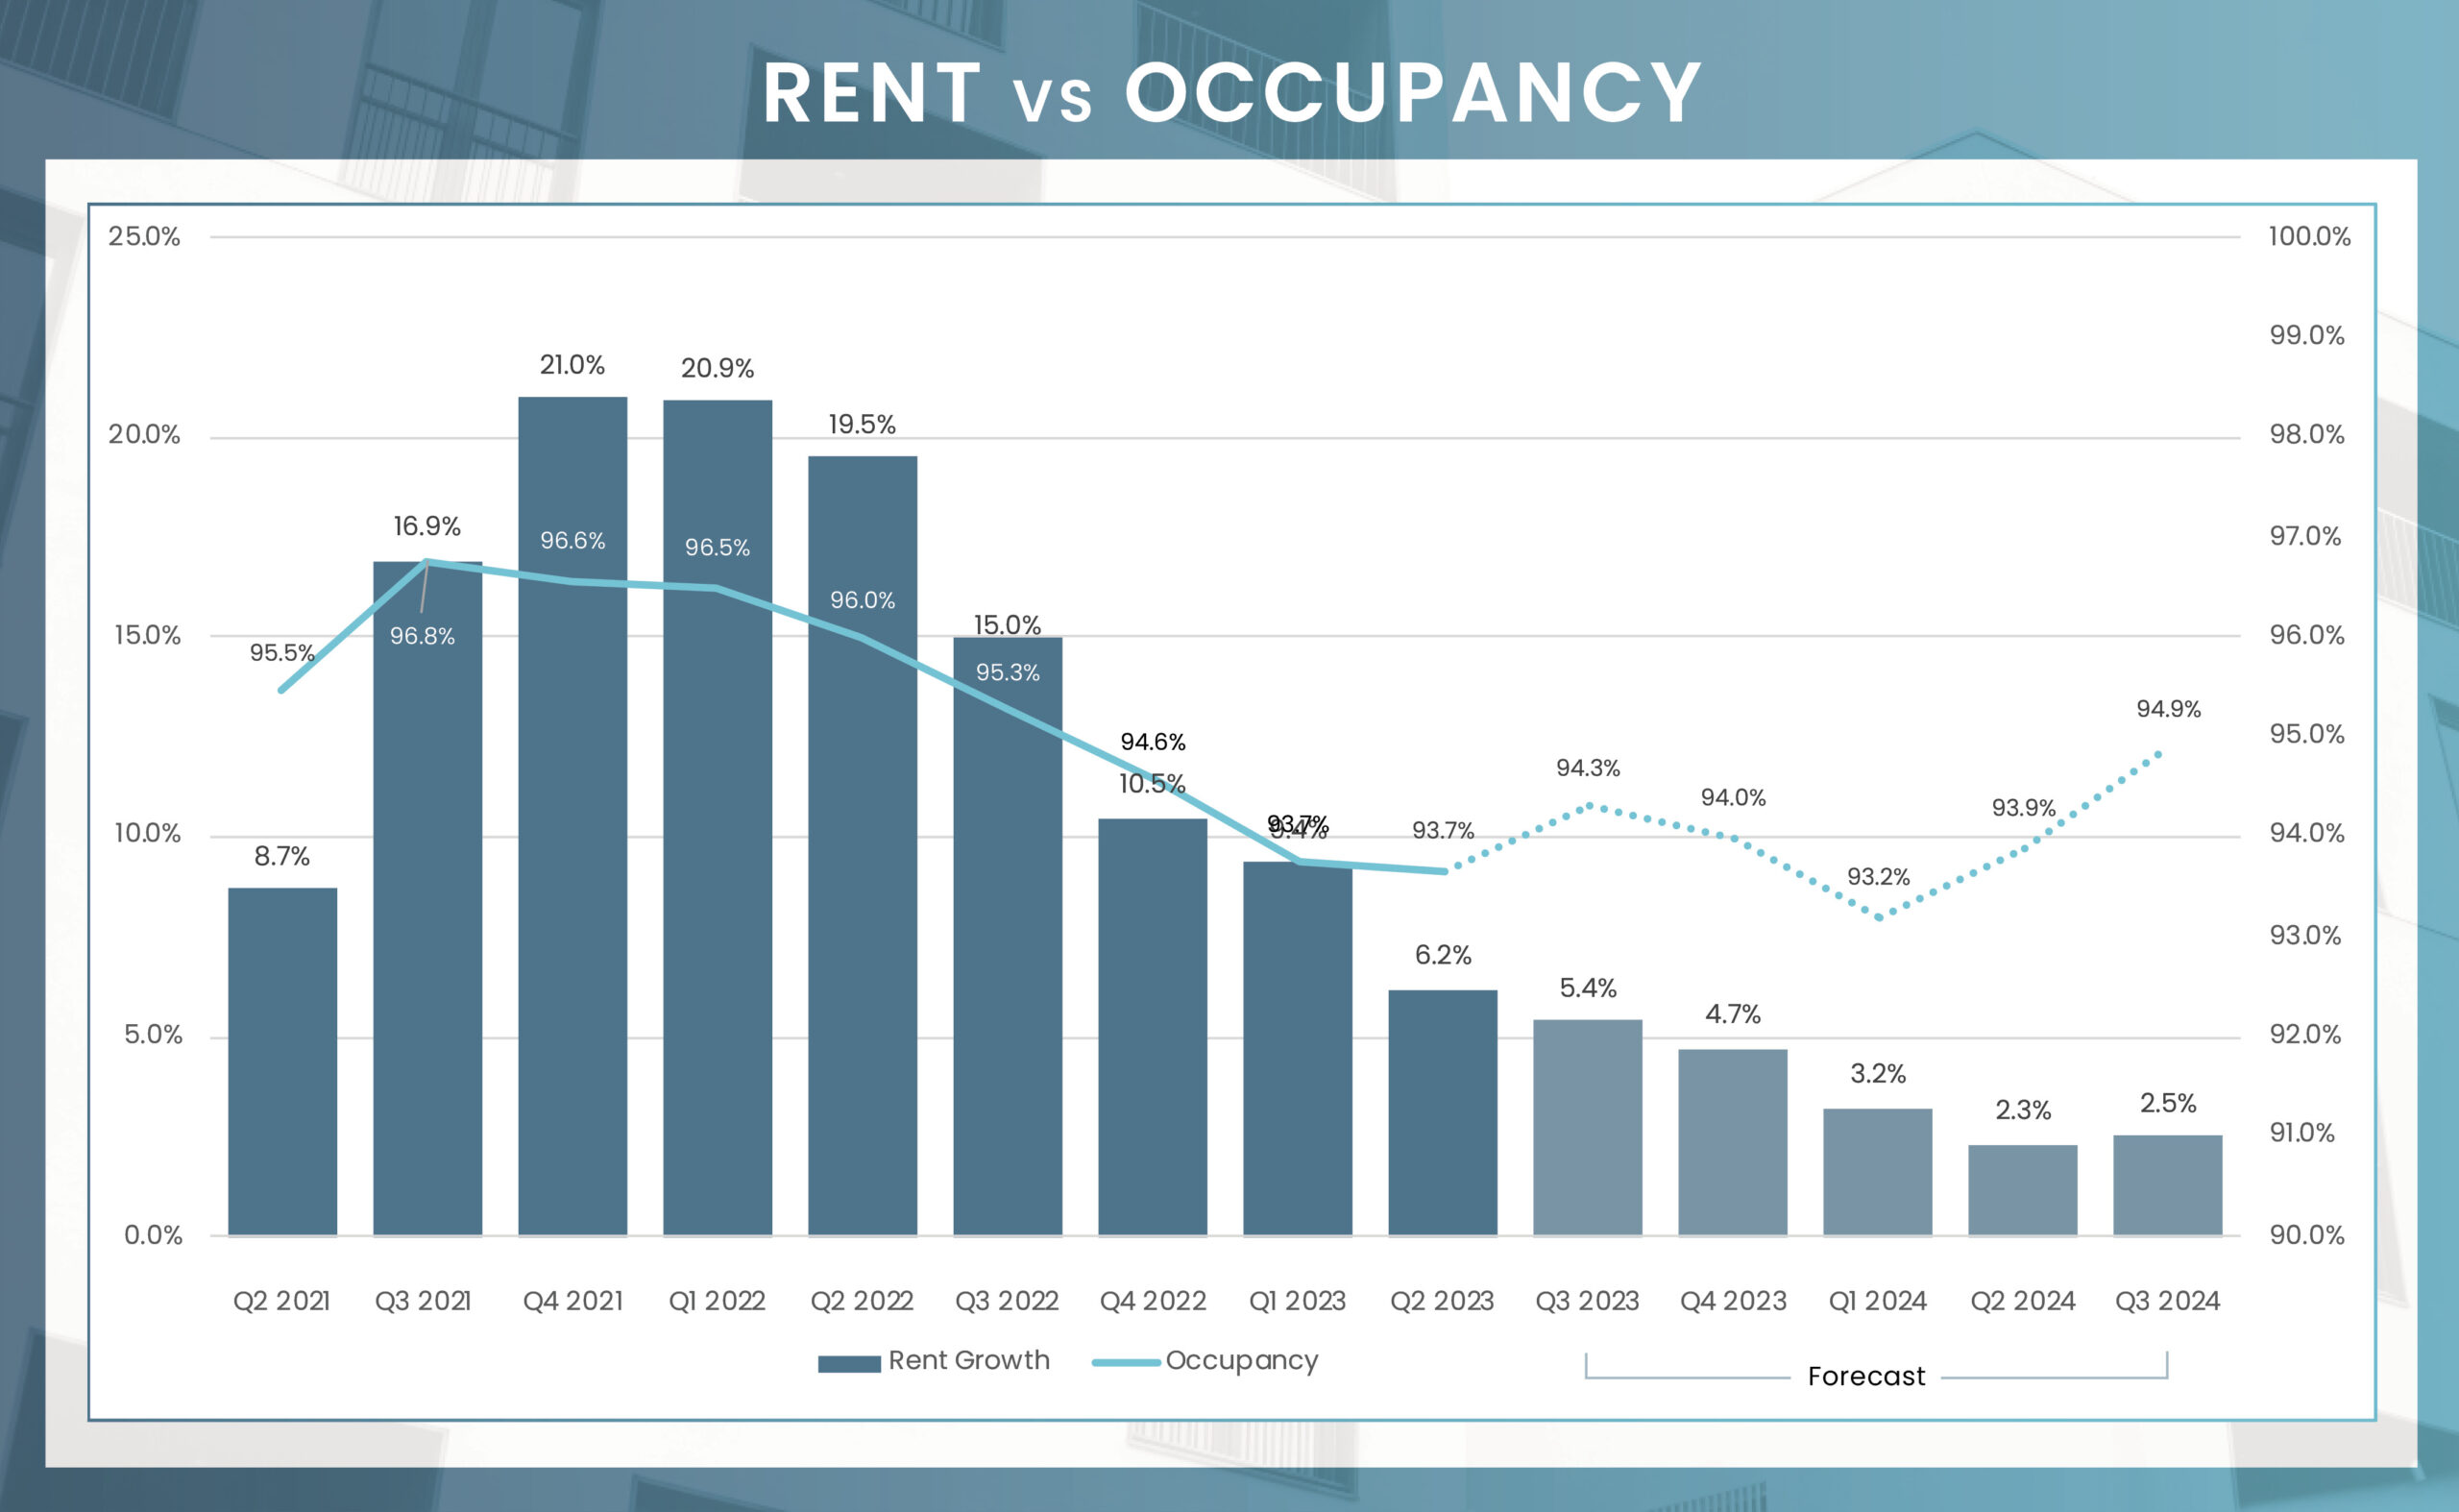
Despite a year-over-year decline of 230 basis points, the market remains resilient, sustaining a healthy occupancy rate of 93.7% in the recent quarter. Class A units led the way with the highest occupancy at 94.2%, closely trailed by Class C and Class B units at 93.9% and 93.4%, respectively. Occupancy levels were relatively uniform across submarkets, ranging from 92.7% to 94.2%, with North Charleston/Goose Creek standing out with the strongest rate. Even with the potential risks tied to an increased supply, projections indicate a solid occupancy rate of around 93.9% for the coming year. This outlook underscores Charleston’s market resilience and readiness for potential rebound.
In Q2 2023, the Charleston metro demonstrated resilience in its rent performance, even as other markets saw a neutralization of rent gains. With a year-over-year growth rate of 6.2% in rents, Charleston fell slightly short of the market’s five-year average of 7.3% yet maintained a healthy led over neighboring markets in the southeast. Class A units were the winners in the second quarter, showcasing a robust annual increase of 7.2%, followed closely by Class C units at 6.9% and Class B units at 5.3%. Submarket analysis revealed Downtown/Mount Pleasant/Islands as a standout performer with a 7.0% annual rent increase, with North Charleston/Goose Creek trailing closely at 6.8%. These trends speak to the enduring strength and allure of the Charleston rental market, maintaining positive growth despite broader economic variables.
| Submarket | Average Occupancy | Annual Occupancy Change | Average Monthly Rent | Annual Rent Change |
|---|---|---|---|---|
| Downtown/Mount Pleasant/Islands | 94.0% | -2.5% | $2,155 | 7.0% |
| West Ashley | 93.8% | -2.2% | $1,633 | 5.9% |
| North Charleston/Goose Creek | 94.2% | -2.2% | $1,474 | 6.8% |
| Summerville/Northwest Charleston | 92.7% | -2.2% | $1,595 | 4.5% |
| Charleston-North Charleston, SC | 93.7% | -2.3% | $1,749 | 6.2% |
Units Under Construction
Units UC Delivering In the Next 4 Quarters
The Charleston apartment market saw a subdued start in transaction activity for 2023. MSCI Real Capital Analytics data reveals that only six properties were sold in the first half of the year, leading to a trade volume of $246.3 million—a substantial 63.9% decrease from the previous year. However, it’s not all a downward trend; the average price per unit in these transactions climbed by an impressive 8.4%, reaching $238,900, outpacing the same period last year. Even though transaction levels are projected to be lower compared to previous years, Charleston’s relative affordability and solid economic foundations keep it attractive to investors. With a future outlook that remains bright, the market’s resilience and growth potential are anticipated to keep investor interest alive and well.
* Trailing 4Q average PPU
* Preliminary Data from RCA – Individual transaction $2.5M +
In May 2023, the Charleston-North Charleston, SC metro area experienced a net gain of 23,000 jobs from May 2022, representing a 5.9% increase in employment. As a result, the unemployment rate fell by 30 basis points compared to the previous year, reaching 2.4%, which is significantly lower than the national benchmark of 3.4%. The professional and business services sector saw the most significant job gains, with 7,200 positions added, reflecting a 11.6% expansion. The sector growth was led by the leisure and hospitality industry, which experienced an expansion of 7.3% with 3.800 jobs added.
May Annual Jobs Created
May 23 Employment growth
May 23 Unemployment rate
3.4% us may rate
Change from May 2022 to May 2023:
7,200
Percent Change:
11.6%
Change from May 2022 to May 2023:
3,800
Percent Change:
7.3%
Change from May 2022 to May 2023:
2,600
Percent Change:
5.8%
Change from May 2022 to May 2023:
2,400
Percent Change:
8.3%
Change from May 2022 to May 2023:
1,800
Percent Change:
2.5%
| Sector | Change from May 2022 to May 2023 | Percent Change |
|---|---|---|
| Professional and business services | 7,200 | 11.6% |
| Leisure and hospitality | 3,800 | 7.3% |
| Education and health services | 2,600 | 5.8% |
| Manufacturing | 2,400 | 8.3% |
| Trade, transportation, and utilities | 1,800 | 2.5% |
| Financial activities | 1,700 | 9.4% |
| Government | 1,600 | 2.4% |
| Mining, logging, and construction | 1,000 | 4.7% |
| Information | 800 | 9.3% |
| Other services | 100 | 0.6% |


Despite a nationwide slowdown, investor interest in the Charleston market remains robust. As of Q2 2023, an impressive 7,331 housing units are under construction, with around 4,159 units slated for completion in the next four quarters. The substantial influx of new construction, most of which is expected to be absorbed by mid-2024, poses little concern. The new inventory will be strategically spread across various submarkets, with Downtown/Mount Pleasant/Islands, Summerville/Northwest Charleston, and North Charleston/Goose Creek leading, contributing 1,244, 1,240, and 1,052 units, respectively. Overall, the occupancy rate in Charleston is anticipated to remain stable, although some softening in rent growth may occur. Charleston’s positive economic outlook signals continued resilience and potential for growth, painting an encouraging picture for the future.