average rent
average occupancy rate
ytd sales volume
YoY rent change
yoy occupancy change
ytd individual transactions
QUARTERLY DEMAND
YTD: 2,966
QUARTERLY COMPLETIONS
YTD: 5,096


Average Monthly Mortgage Payment*
Average Monthly Rent
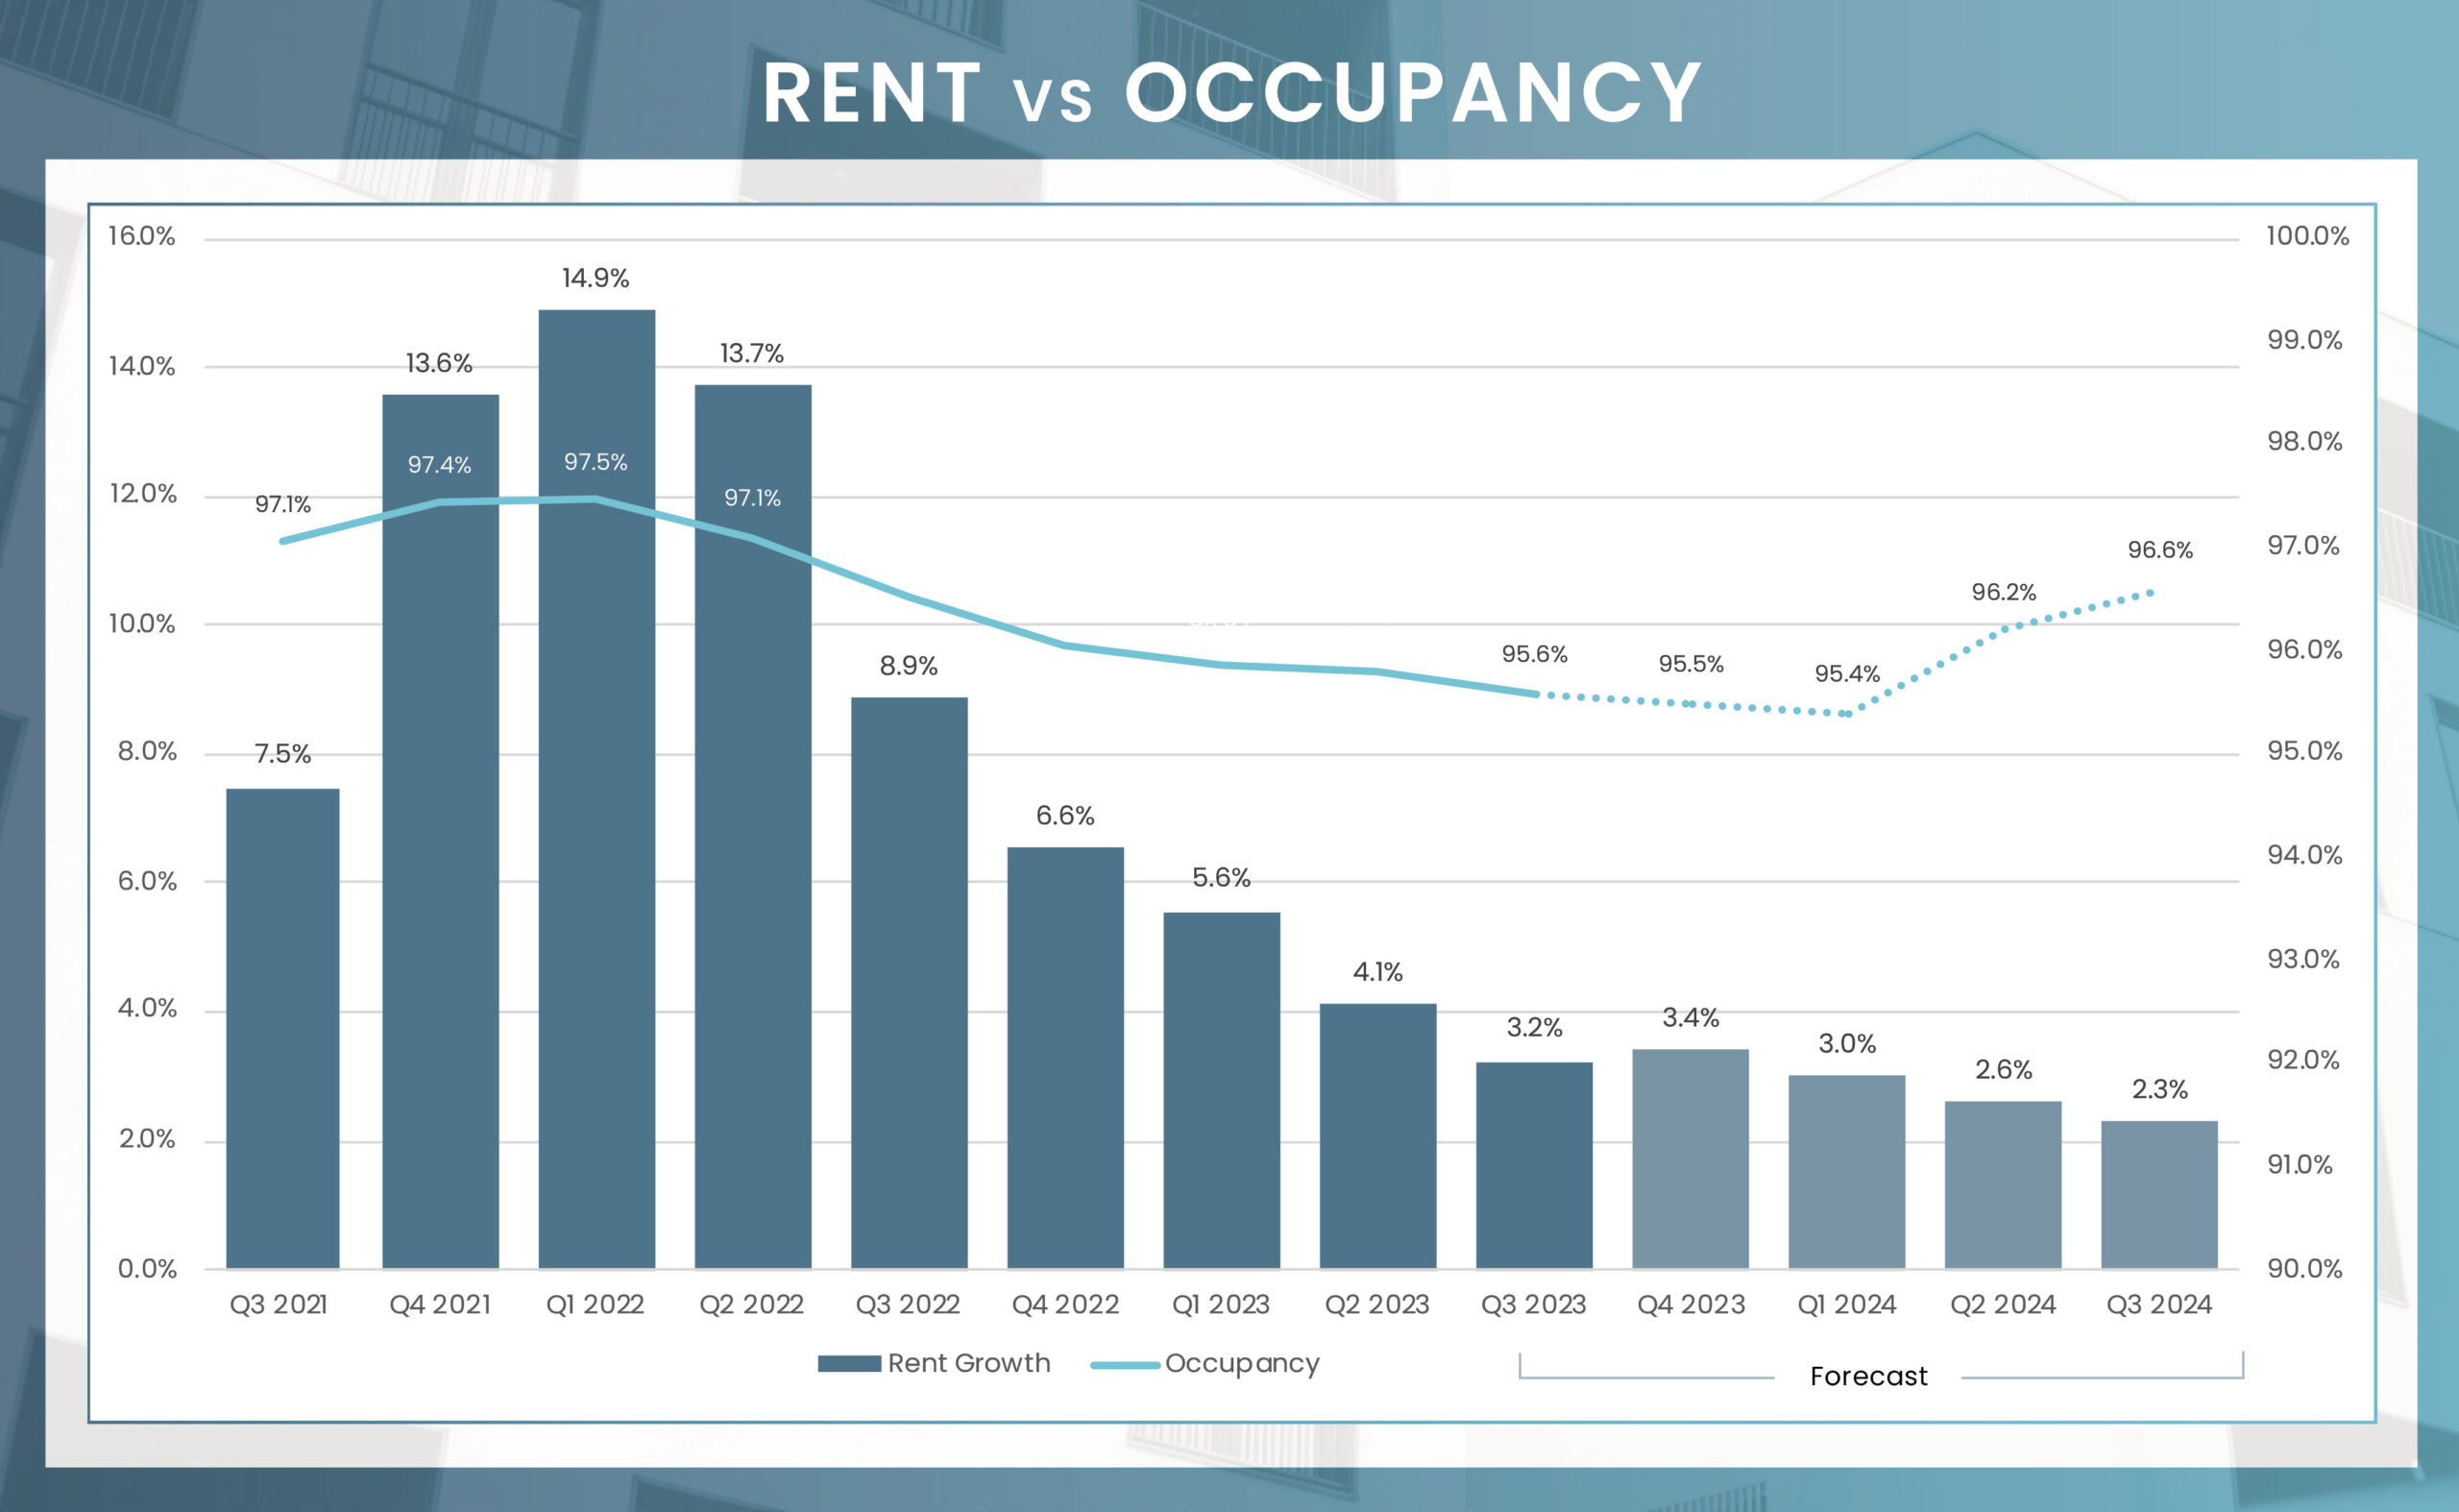
In the third quarter of 2023, the Boston-Cambridge-Newton, MA-NH multifamily market maintained a robust occupancy rate of 95.6%, although this represented a slight year-over-year decline of 90 basis points. Across the spectrum of property classes, occupancy remained robust—Class C led the pack with 96.6%, followed by Class B at 95.4%, and Class A at 94.8%. The majority of Boston’s submarkets boasted solid occupancy rates above 95%, with Rockingham/Strafford Counties standing out at over 97%. Even Fenway/Brookline/Brighton, at a somewhat lower 93.6%, remained competitive. As we move forward, the market is anticipated to see a slight uptick in occupancy, driven by demand outpacing new supply, projecting an occupancy rate of approximately 96.7% by Q3 2024.
In Q3 2023, the Boston-Cambridge-Newton, MA-NH area enjoyed a healthy 3.2% year-over-year increase in average multifamily rents, hitting $2,939 per month and ranking it among the nation’s top markets. Performance varied among property classes; Class A rents rose by 3.7%, while Class B and C saw increases of 3.2% and 2.7%, respectively. Certain submarkets, notably Southwest Boston and Chelsea/Revere/Charlestown, outperformed the rest with rent hikes of 5.2% and 4.7%. Conversely, Plymouth County and Rockingham/Strafford Counties saw minimal decreases, fluctuating by 0.1% and 0.5%. As the market absorbs new inventory, rent growth is expected to remain consistent in the 3.0% to 3.5% range.
| Submarket | Average Occupancy | Annual Occupancy Change | Average Monthly Rent | Annual Rent Change |
|---|---|---|---|---|
| Cambridge/Somerville | 94.9% | -1.3% | $3,650 | 3.4% |
| Chelsea/Revere/Charlestown | 94.4% | -1.6% | $2,916 | 4.7% |
| East Middlesex County | 95.5% | -0.9% | $2,786 | 3.6% |
| Fenway/Brookline/Brighton | 93.6% | -2.6% | $3,620 | 3.7% |
| Intown Boston | 96.5% | -0.2% | $4,085 | 4.0% |
| Lowell | 95.4% | -1.4% | $2,402 | 2.3% |
| Marlborough/Framingham | 95.9% | -0.7% | $2,479 | 2.4% |
| North Essex County | 96.7% | -0.7% | $2,298 | 4.2% |
| Plymouth County | 96.2% | -1.0% | $2,317 | 0.1% |
| Quincy | 95.7% | -0.9% | $2,629 | 2.5% |
| Rockingham/Strafford Counties | 97.5% | -0.5% | $2,021 | 0.5% |
| South Essex County | 96.4% | -0.1% | $2,654 | 1.1% |
| Southwest Boston | 94.6% | -0.5% | $2,763 | 5.2% |
| Waltham/Newton/Lexington | 96.3% | -0.2% | $3,231 | 3.1% |
| West Norfolk County | 95.0% | -1.6% | $2,742 | 3.6% |
| Boston-Cambridge-Newton, MA-NH | 95.6% | -0.9% | $2,939 | 3.2% |
Units Under Construction
Units UC Delivering In the Next 4 Quarters
Amid a tightening financial environment, investor interest in the Boston apartment market remains robust. During the first three quarters of 2023, conventional single-asset apartment transactions totaled a substantial $1.8 billion. Although this marks a 24% year-over-year decrease, it’s noteworthy that 46 properties changed hands, closely resembling pre-pandemic transaction levels for the same period. Even more striking is the 5.9% year-over-year increase in the average price per unit, bringing the market’s average to an impressive $439,100 per unit. This underscores the market’s resilience and enduring appeal to investors.
* Trailing 4Q average PPU
* Preliminary Data from RCA – Individual conventional transaction $2.5M +
August 2023 brought a remarkable surge in job growth to the Boston metro, with an impressive addition of 79,600 jobs compared to the same month in 2022. This translates to a substantial 2.9% increase in employment. Consequently, the unemployment rate saw a significant drop of 0.9 percentage points compared to the previous year, now standing at a low 2.7%, well below the national average of 3.9%. Examining specific sectors, the education and health services industry led the charge with the most substantial job gains, boasting an impressive addition of 23,100 positions, representing a significant 4.0% expansion. The professional and business services sector followed closely, experiencing a comparable growth rate of 3.8% and contributing 20,400 jobs to the mix. These positive indicators underscore the region’s robust economic momentum and promising employment prospects. Notably, the average hourly wage in Boston stands at an impressive $38.85, surpassing the US average of $29.76, further emphasizing the strength and attractiveness of the region’s job market.
August Annual Jobs Created
August 23 Employment growth
August 23 Unemployment rate
3.9% us August rate
Change from August 2022 to May 2023:
23,100
Percent Change:
4.0%
Change from August 2022 to August 2023:
20,400
Percent Change:
3.8%
Change from May 2022 to May 2023:
14,500
Percent Change:
5.3%
Change from August 2022 to August 2023:
7,200
Percent Change:
5.5%
Change from August 2022 to August 2023:
5,200
Percent Change:
1.3%
| Sector | Change from Aug 2022 to Aug 2023 | Percent Change |
|---|---|---|
| Education and health services | 23,100 | 4.0% |
| Professional and business services | 20,400 | 3.8% |
| Leisure and hospitality | 14,500 | 5.3% |
| Mining, logging, and construction | 7,200 | 5.5% |
| Trade, transportation, and utilities | 5,200 | 1.3% |
| Financial activities | 5,000 | 2.7% |
| Government | 4,200 | 1.5% |
| Other services | 900 | 0.9% |
| Information | 100 | 0.1% |
| Manufacturing | (1,000) | -0.5% |
Boston, Massachusetts beckons to a multitude of young professionals along the eastern seaboard, proving itself as an alluring alternative to its Northeastern counterpart, New York City, New York. The city of Boston extends a generous hand when it comes to cost savings in crucial aspects of life. Comparing the two cities, Boston offers an impressive 10.5% average reduction in grocery expenditures. Furthermore, despite its reputation for a steep cost of living, Bostonians typically enjoy a substantial 55.0% savings when it comes to housing expenses compared to New York City. As of now, the median home price in Boston hovers at $734,200, demonstrating a modest 1.7% increase year-over-year. Notably, the average monthly mortgage payment of $5,423 in Boston far surpasses the average rent of $2,939, making renting a notably favorable choice compared to alternative housing arrangements.
148.3
$5,423
219.9
127.2
127.2
$734,200
The “Cost of Living” index score provides a comparative assessment of the relative expense involved in maintaining a standard of living in a specific area, benchmarked against a national index score of 100.
Boston has displayed remarkable resilience in the face of the pandemic, surpassing the performance of many other coastal gateway markets. As of Q3 2023, there are currently 14,693 housing units under construction, with an additional 9,827 units expected to be completed by late 2024. Apartment absorption has returned to its usual levels, aligning with historical trends. Noteworthy demand hotspots for the upcoming year include Fenway/Brookline/Brighton, Cambridge/Somerville, and Chelsea/Revere/Charlestown, collectively accounting for 38.6% of the overall absorption. Despite the concentration of new inventory in these areas, the combination of robust demand and sustained economic growth is anticipated to uphold high occupancy rates and stabilize rent performance. This will ensure the presence of solid fundamentals in Boston’s apartment market, reaffirming its resilience and continued stability.