Boston 2024 Market Forecast

MARKET SNAPSHOT

AVERAGE RENT

$2,728  4Q 2023

$2,845  4Q 2024

2024 RENT CHANGE

4.3%

OCCUPANCY RATE

96.1% 4Q 2023

95.8% 4Q 2024

4Q 2024 OCCUPANCY CHANGE

-30 POINTS

EMPLOYMENT*

2.87M 2023

2.90M 2024

UNEMPLOYMENT RATE**

2.7% 2023

3.0% 2024

* Please note that these employment figures have been adjusted for seasonal variations and are based on Moody’s Analytics forecast as of January 1, 2024.

** Please note that these unemployment rates are estimates that have not been adjusted for seasonal variations, and they are derived from Moody’s Analytics forecast as of January 1, 2024.

KEY TAKEAWAYS

  • Boston’s apartment market rebounded strongly by the end of 2023, with a net absorption of roughly 7,000 units. High occupancy rates above 94% are expected to continue over the coming year.

  • Boston added 8,797 new units and has 12,222 under construction in 2023. Looking ahead into 2024, the balance of new supply with strong demand is anticipated to maintain high occupancy and stable rent levels.

  • The market’s rent growth is forecasted to increase 4.3% over the next year, outpacing the national average. This improvement will be felt across all submarkets.

  • Closing out 2023 with a firm $2.6 billion in sales, Boston’s robust investment climate continues to be underpinned by unwavering investor interest, solid fundamentals and a strong job market.

Supply & Demand

2024 FULL YEAR FORECAST

5,030 Units

FORECASTED ABSORPTION

5,559 Units

FORECASTED NEW SUPPLY

Annual Demand vs Completions

Demand / Occupancy Outlook

By the end of 2023, Boston’s apartment market witnessed a significant recovery, marking a net absorption of 6,966 units, the highest since 2021 and in line with historical patterns. The one-year forecast predicts positive net absorption in 24 out of 31 submarkets by the end of 2024. Key demand areas such as Fenway/Mission Hill, South Plymouth County, and Roxbury/Dorchester are expected to contribute 30% of the total absorption across these submarkets. The upcoming four quarters look promising for Boston’s multifamily market, with an anticipated absorption of 5,030 net units, matching the estimated number of new units becoming available during this period.

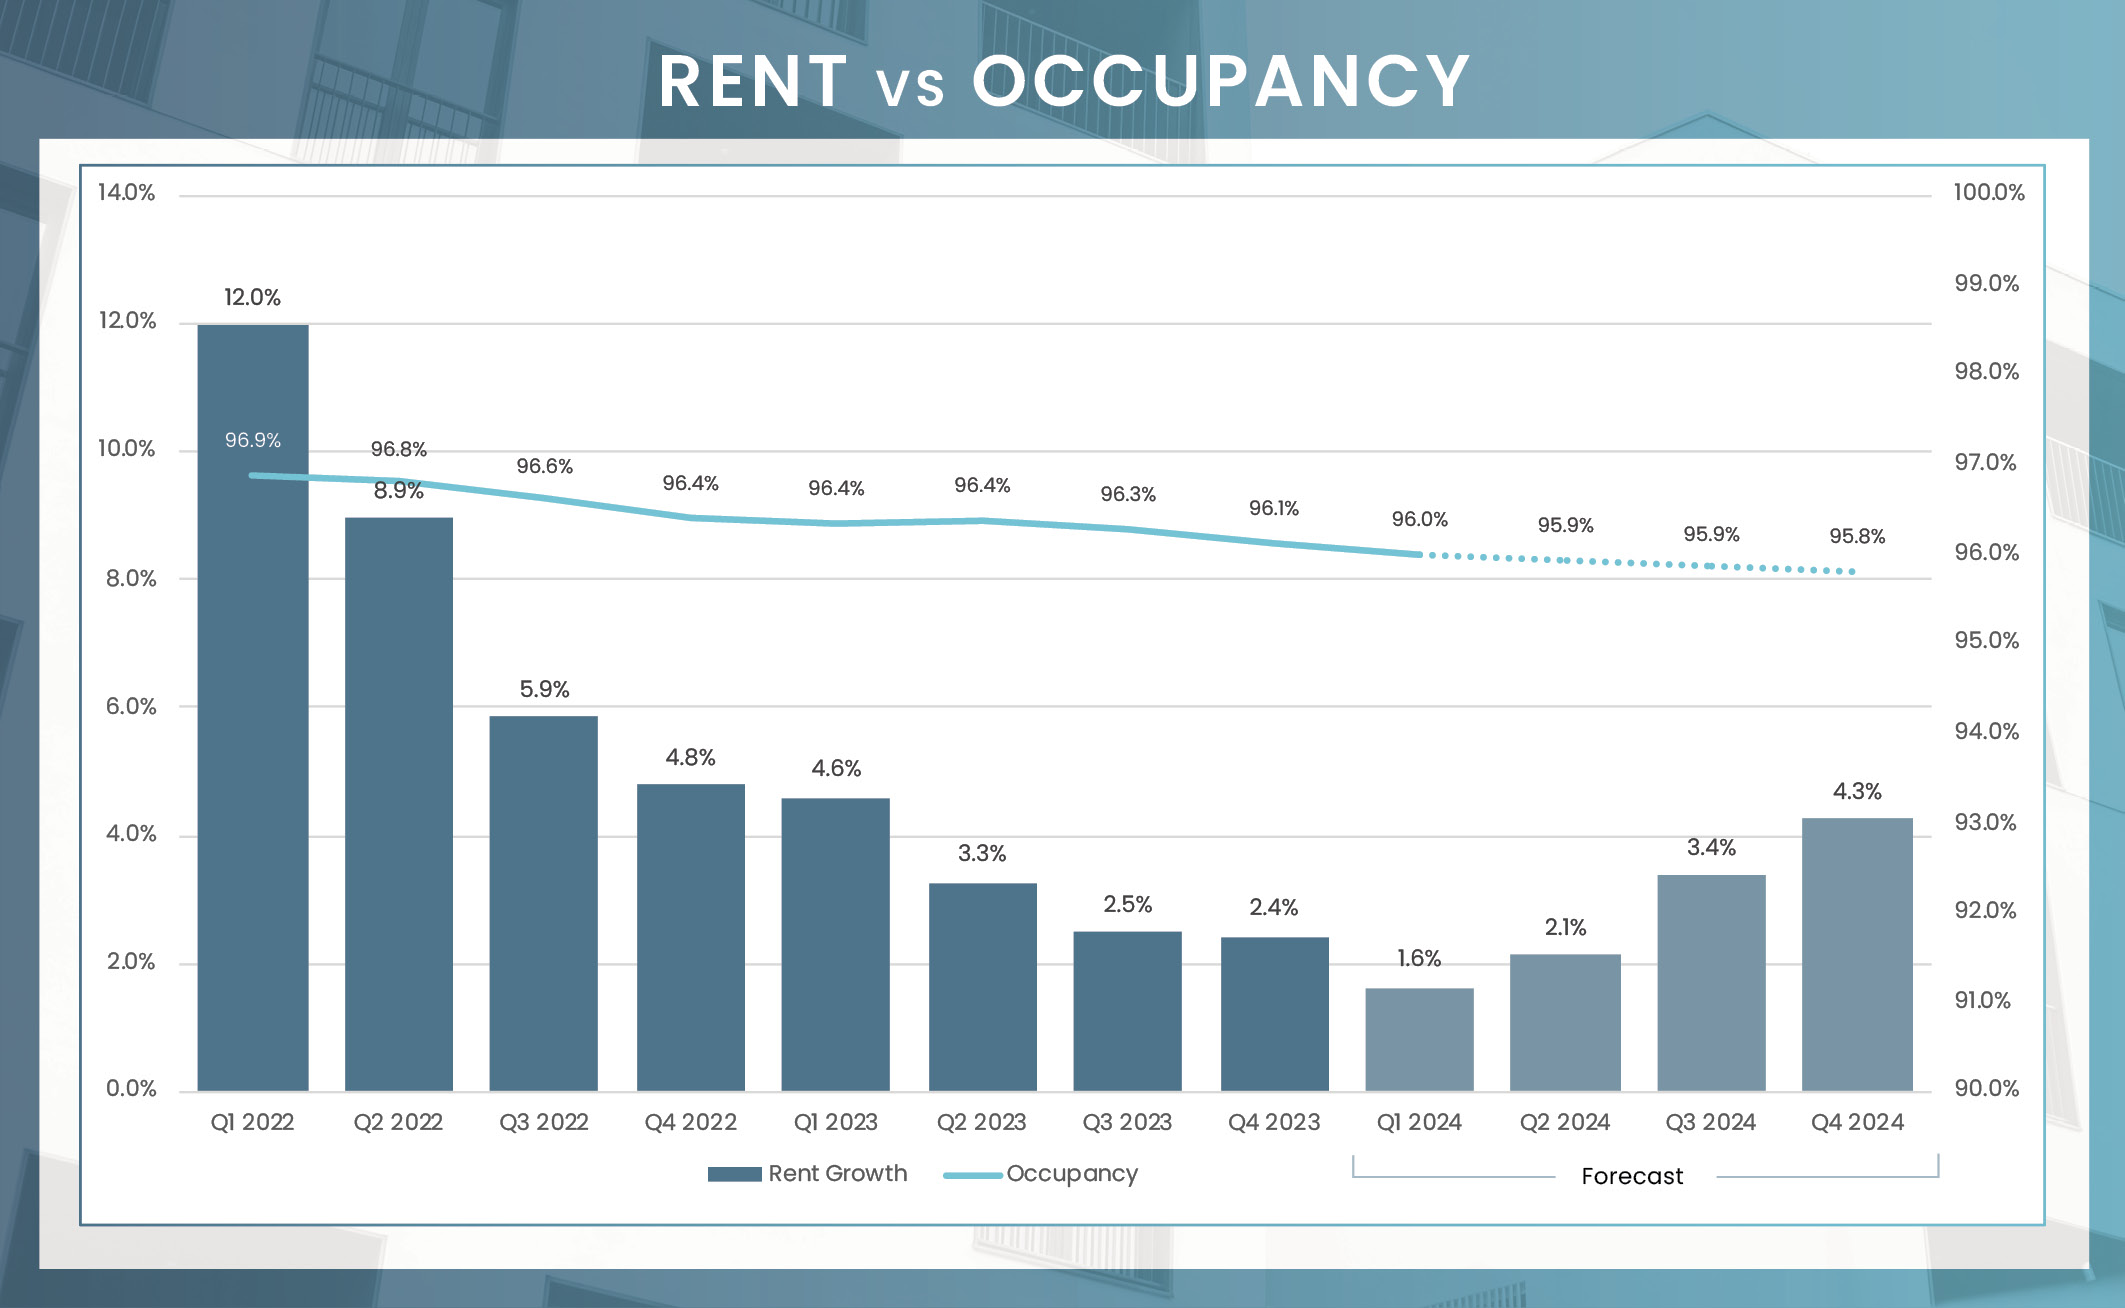
The multifamily market in Boston maintained a strong occupancy rate of 96.1% by the final quarter of 2023, despite a slight year-over-year decrease of 30 basis points. Occupancy rates remained high across various property classes, with all but one of Boston’s submarkets having rates above 94%. Notably, Back Bay/South End and New Hampshire Beaches led with over 97% occupancy. Moving into 2024, the market is expected to experience a minor dip in occupancy, settling around 95.8% by Q4 due to supply and demand dynamics. However, the majority of submarkets are projected to maintain solid occupancy rates above 94%.

New Supply Outlook

Boston has demonstrated impressive resilience during the pandemic, outperforming many other coastal gateway markets. By the end of 2023, the city’s apartment market saw the addition of 8,797 units, a figure in line with historical norms. A significant portion of the new apartment inventory over the past year was contributed by developments in South Plymouth County.

Currently, there are 12,222 apartment units under construction in Boston, with 5,559 of these expected to be completed within the next year. A large share of these upcoming units will be delivered in Fenway/Mission Hill. Despite new inventory being concentrated in 19 out of Boston’s 31 submarkets, the combination of strong demand in the market and ongoing economic growth is likely to support high occupancy rates and maintain stable rent levels. This trend underscores the solid fundamentals of Boston’s apartment market, reinforcing its resilience and ensuring its continued stability in the face of challenges.

Occupancy & Rent Trends

RENT VS OWN MONTHLY PAYMENT

$3,971

Average Monthly Mortgage Payment

$2,728

Average Monthly Rent

2024 Rent trends outlook

In 2023, the Boston apartment market experienced a modest rent growth of 2.4%, with average multifamily rents reaching $2,728 per month. This rate, though below the city’s long-term historical average, still surpasses the national benchmark. The recent slowdown in rent growth is attributed to the influx of new supply alongside a demand that is still normalizing after its decline in 2020 and subsequent rapid recovery in 2021.

Looking forward, Boston’s multifamily rent growth is projected to accelerate, 4.3% over the next year, a rate that significantly will exceed the national average. All submarkets across Boston are expected to show strong performance in this period above 3.6%. The high-end Back Bay/South End neighborhood is anticipated to lead with an estimated 4.7% year-over-year rent growth for 2024. Even more affordable areas, such as Strafford County, are predicted to witness a similar uptick in rents, at around 4.6%. Overall, these trends indicate that Boston is likely to continue its steady performance as a major market, maintaining its standing among the nation’s top markets for apartment rentals.

Submarket Rent & Occupancy

SubmarketQ4 2023 Stabilized OccupancyQ4 2024 Stabilized Occupancy (f)Annual Occupancy Change (2024/2023)Q4 2023 Average Monthly RentQ4 2024 Average Monthly Rent (f)Annual Rent Change (2024/2023)
49595.7%95.3%-0.4%$2,305$2,4094.5%
93 North96.6%96.4%-0.3%$2,600$2,7084.2%
Alewife95.6%95.2%-0.4%$3,125$3,2443.8%
Allston/Brighton96.1%95.8%-0.3%$2,850$2,9724.2%
Back Bay/South End97.8%97.6%-0.2%$3,832$4,0114.7%
Brookline/Newton/Watertown97.1%96.8%-0.3%$3,147$3,2904.5%
Burlington/Woburn96.6%96.3%-0.3%$2,787$2,8893.6%
Chelmsford/Tyngsborough/Townsend94.4%94.0%-0.4%$2,380$2,4774.1%
Downtown Boston96.8%96.6%-0.2%$3,874$4,0514.6%
East Boston/Chelsea95.9%95.6%-0.4%$2,760$2,8764.2%
Everett/Malden/Medford/Melrose95.2%94.9%-0.4%$2,653$2,7624.1%
Fenway/Mission Hill96.2%95.9%-0.3%$3,392$3,5253.9%
Harvard MIT95.4%95.1%-0.3%$3,658$3,8194.4%
JP/Roslindale/West Roxbury 96.8%96.5%-0.3%$2,457$2,5574.1%
Lawrence/Haverhill96.4%96.1%-0.3%$2,005$2,0934.4%
Lowell/Dracut97.2%96.9%-0.3%$1,936$2,0254.6%
Metro West96.8%96.5%-0.3%$2,476$2,5884.5%
New Hampshire Beaches97.8%97.5%-0.3%$2,079$2,1744.6%
North Shore97.1%96.8%-0.3%$2,375$2,4784.3%
Quincy/Milton/Randolph94.7%94.3%-0.5%$2,525$2,6243.9%
Route 1 North96.5%96.1%-0.4%$2,359$2,4624.4%
Route 1 South95.5%95.2%-0.4%$2,468$2,5764.4%
Route 297.1%96.8%-0.3%$2,711$2,8344.6%
Roxbury/Dorchester89.1%88.5%-0.7%$2,642$2,7393.7%
Somerville/Charlestown94.9%94.5%-0.4%$3,140$3,2664.0%
South Boston/Seaport96.4%96.2%-0.2%$4,125$4,2863.9%
South Plymouth County97.1%96.8%-0.3%$2,248$2,3333.8%
South Shore95.5%95.1%-0.4%$2,442$2,5484.3%
Strafford County97.3%96.9%-0.3%$1,737$1,8174.6%
Suburban Rockingham County97.6%97.3%-0.3%$1,909$1,9934.4%
Waltham/Arlington/Belmont96.1%95.8%-0.3%$2,844$2,9744.6%
Market96.1%95.8%-0.3%$2,728$2,8454.3%

Submarket Construction Pipeline

150,422

4Q 2023 Unit Inventory

12,222

Number of Units Under Construction

5,559

Number of Units UC Delivering
In the Next 4 Quarters

SubmarketUnit Inventory: 4Q 2023Units Under Construction% of Existing Inventory UC% of Total UCUnits UC Delivering In the Next 4 Quarters
4955,42800%0.0%0
93 North8,1345036%12.2%279
Alewife5,357491%1.2%0
Allston/Brighton10,4961,19411%28.9%264
Back Bay/South End11,37700%0.0%0
Brookline/Newton/Watertown10,4197817%18.9%291
Burlington/Woburn6,717961%2.3%95
Chelmsford/Tyngsborough/Townsend5,1642004%4.8%199
Downtown Boston11,50000%0.0%0
East Boston/Chelsea6,0831,07718%26.1%474
Everett/Malden/Medford/Melrose11,9471,58713%38.4%449
Fenway/Mission Hill10,8368818%21.3%880
Harvard MIT10,782380%0.9%0
JP/Roslindale/West Roxbury 7,1703805%9.2%201
Lawrence/Haverhill10,1283053%7.4%23
Lowell/Dracut6,92900%0.0%0
Metro West14,1826364%15.4%275
New Hampshire Beaches3,16900%0.0%0
North Shore13,8533132%7.6%179
Quincy/Milton/Randolph12,7413052%7.4%0
Route 1 North12,6028987%21.7%453
Route 1 South9,21800%0.0%0
Route 24,76800%0.0%0
Roxbury/Dorchester8,09479310%19.2%245
Somerville/Charlestown6,4032534%6.1%24
South Boston/Seaport6,748771%1.9%0
South Plymouth County9,7582693%6.5%0
South Shore10,9202702%6.5%269
Strafford County6,0664187%10.1%417
Suburban Rockingham County6,0212304%5.6%229
Waltham/Arlington/Belmont8,8226698%16.2%313
Market150,42212,2228.1%100.0%5,559

Sales Activity

In 2023, Boston’s multifamily real estate market demonstrated resilience, maintaining robust sales activity amidst a nationwide dip in transaction volumes. The market witnessed a total of $2.6 billion in apartment asset sales last year, marking a modest 11.2% decrease from the 2022 figures. Despite this drop, the annual deal volume closely mirrored the pre-pandemic levels. Notably, the fourth quarter alone saw a significant increase in activity, with sales reaching approximately $647 million, a 22% rise from the same period in the previous year, distinguishing Boston from other markets.

Furthermore, the market remained strong in terms of per-unit pricing, which averaged $426,500 by the end of the year, up 6.8% annually. In terms of property types, mid/high-rise deals constituted 76% of all transactions last year, with garden-style properties making up a smaller portion. Additionally, the composition of buyers in Boston’s multifamily market evolved in 2023. While public and institutional buyers seemed to pull back a little, there was heightened interest from private and international investors. Historically, private investors have predominated in acquisitions within the Boston market, often alternating with institutional investors. This trend suggests that sustained focus on similar properties could keep the transactional momentum in Boston’s market buoyant in the foreseeable future.

  1. Brookfield AM
  2. UDR
  3. DSF Group
  4. Lincoln Property Co
  1. Nicol Investment Co
  2. Boston Residential
  3. AvalonBay
  4. Brookfield AM

*Most Active Buyers and Sellers are based on the sale volume of apartment units.

TRANSACTION VOLUME


2023 Transaction Volume

Y-O-Y Change

Individual Transaction Count

Price Per Unit

Annual PPU Price Change

* Trailing 4Q average PPU

* Preliminary Data from RCA – Individual transaction $2.5M +

P=Preliminary

Employment Forecast

Forecasted 2024 Employment Sector Growth

SectorEmployment Change 2023 to 2024 Percent Change
Overall Employment26,200 0.9%
Manufacturing100 0.1%
Construction2,100 1.7%
Trade, Transport., & Utilities4,800 1.1%
Information200 0.2%
Financial Activities1,600 0.8%
Professional & Business Services1,800 0.3%
Education & Health Services10,300 1.7%
Government2,100 0.7%
Leisure & Hospitality2,600 1.0%
Natural Resources & Mining100 20.0%
Other Services6000.6%

Economic Outlook

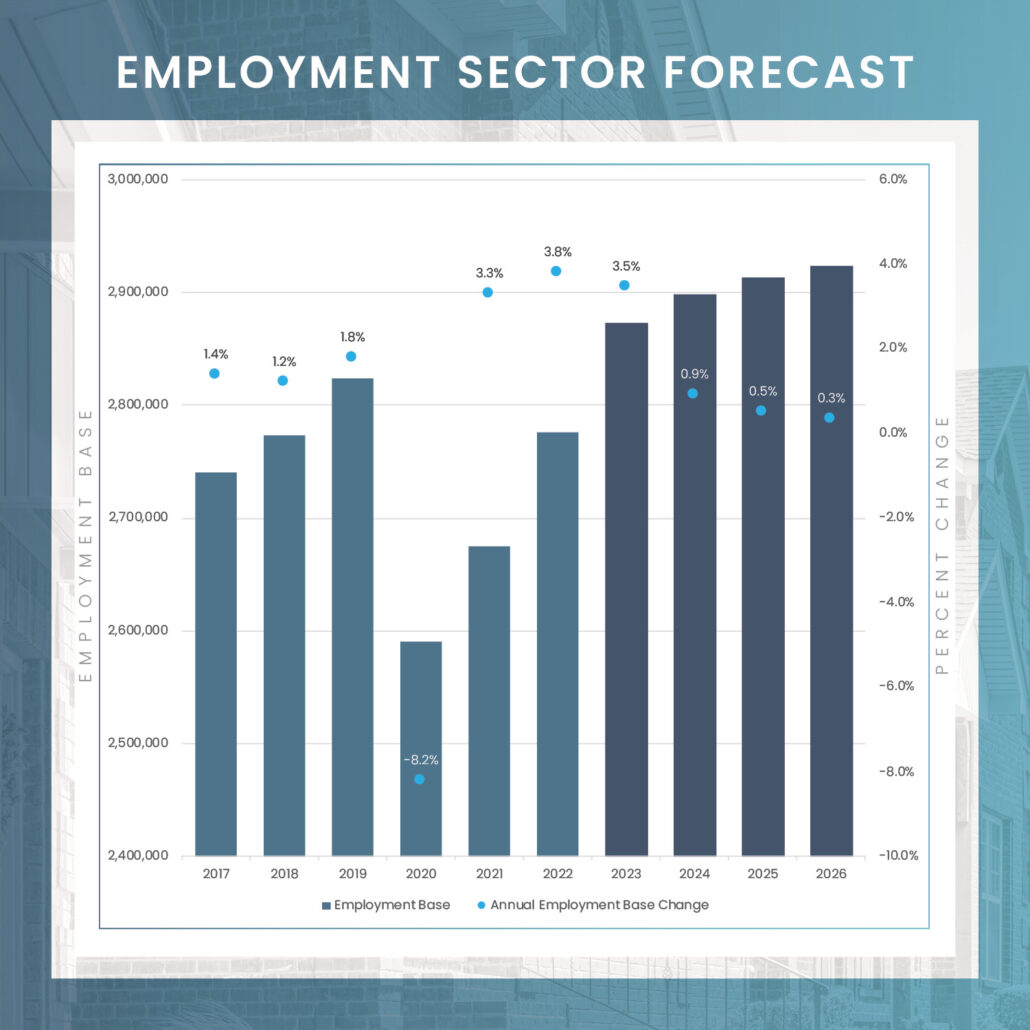
The Greater Boston area has exhibited remarkable job growth, with a 3.5% increase in employment by the end of 2023, achieving a low unemployment rate of 2.7%, well below the national average. The region is expected to add around 26,200 new jobs in the upcoming year. The Education & Health Services sector, bolstered by a highly educated workforce, leads regional employment and is set to grow significantly, contributing 39% of Boston’s new jobs. The Trade, Transport, & Utilities sector also promises notable job additions. Boston’s short-term economic outlook is optimistic, benefiting from lower outmigration and fewer pandemic-related social issues compared to other major markets. The city’s economic strength is underpinned by its role as a major hub for prestigious educational and research institutions including Havard and MIT, alongside thriving sectors like biotech research, healthcare, information services, professional and business services, and finance. Companies like AstraZeneca, Moderna, and financial giants such as Fidelity and John Hancock highlight the diverse economic base. Looking ahead, Boston’s vital industries and skilled labor force position it for strong economic performance relative to the nation and its peer markets.

Sources: Costar; Yardi Matrix; BLS; MSCI; Moody’s Analytics

To Gain Further Insights Into The Boston Market Please Reach Out To Our National Team

Alex Blagojevich

Executive Managing Director & Founding Partner

Michael Sullivan

Executive Managing Director & Founding Partner

Nate Ulepich

National Director of Sales

Brett Meinzer

Managing Director

David Huey

Senior Director

Kendall Adams

Senior Advisor

Ryan Carter

Associate Advisor

Thomas Skevington

Senior Advisor

Kyle Winston

Senior Advisor

Chris Wilson

Associate Advisor