Billings 3Q23
Multifamily Market Report

$1,480

average rent

95.4%

average occupancy rate

165 UNITS

NET DEMAND (YTD: 142)

0.5%

YoY rent change

-1.0 POINT

yoy occupancy change

208 UNITS

NET COMPLETIONS (YTD: 208)

Market Summary

The Billings, MT apartment market is undergoing a dynamic transition, marked by opportunity that is fueled not only by local demand but also by Montana’s faster-than-average population growth. According to the latest U.S. Census data, Montana’s population expanded by 1.5% between July 2021 and July 2022, ranking it sixth in the nation for growth. This uptick has been primarily driven by new residents moving into the state.

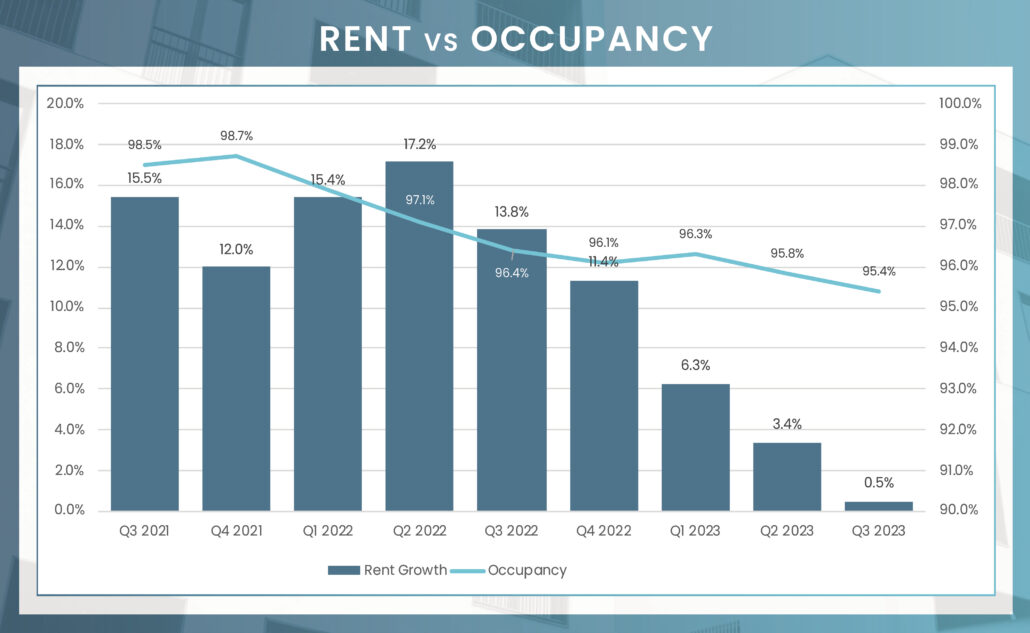
In Q3 2023, the Billings market introduced 208 new apartment units, increasing the total inventory by 2.6%. However, occupancy rates experienced a slight drop, settling at 95.4% year-over-year. Rent saw a modest annual rise of 0.5%, falling short of the five-year average growth of 6.6%. Looking ahead, Billings has a record 1,059 apartment units under construction, 839 of which are slated for Spring 2024 delivery, that will fundamentally alter the inventory of apartments in Billings.

Annual Demand vs Completions

2018
394
9
2019
-2
0
2020
330
97
2021
-24
0
2022
-150
48
2023 YTD
143
208
  • Planned
    Completions
  • Pre-Planned
    Demand

Occupancy & Rent Trends

RENT VS OWN
MONTHLY PAYMENT

$2,971

Average Monthly Mortgage Payment

$1,480

Average Monthly Rent

* The Average mortgage payment is based off a median home sales price of $411,000 as reported by the National Association of Realtors as of Aug 2023.

Submarket Construction Pipeline

Sales Activity

  1. Canyon View Capital
  2. Forge Partners
  3. Quarry Capital
  1. Maxus Realty Trust
  2. Covenant Capital Group
  3. Burkhalter Com’l Group

*Most Active Buyers and Sellers are based on the sale volume of apartment units.

TRANSACTION VOLUME


YTD Transaction Volume

Y-O-Y Change

Individual Transaction Count

Price Per Unit

* Trailing 4Q average PPU

* Preliminary Data from RCA – Individual transaction $2.5M +

Economy

8.1K

August Annual Jobs Created

2.2%

August 2023 Employment growth

3.0%

August 2023 Unemployment rate
3.8% us AUGust rate

Sources: RealPage; BLS; MSCI

Top Employment Sector Annual Change

professional & business services

professional & business services

Change from August 2022 to August 2023:
700

Percent Change:
7.1%

leisure & hospitality

leisure & hospitality

Change from August 2022 to August 2023:
500

Percent Change:
3.7%

Hover over icons to view data
SectorChange from Aug 2022 to Aug 2023 Percent Change
Professional and business services7007.1%
Leisure and hospitality5003.7%
Education and health services00.0%
Mining, logging & Construction00.0%
Other services00.0%
Manufacturing00.0%
Information00.0%
Financial activities00.0%
Government-500-5.5%
Trade, transportation, and utilities-500-2.3%

To Gain Further Insights Into The BILLINGS Market Please Reach Out To Our NATIONAL Team

Image of Alex

Alex Blagojevich

Executive Managing Director / Co-Founder

Image of Michael Sullivan

Michael Sullivan

Executive Managing Director / Co-Founder

Image of David

David Huey

Senior Director

Kendall Adams

Associate Advisor

Ryan Carter

Associate Advisor