Dallas-Fort Worth 3Q23
Multifamily Market Report

$1,552

average rent

93.4%

average occupancy rate

$3.1B

ytd sales volume

-0.5%

YoY rent change

-1.6 POINTS

yoy occupancy change

88

ytd individual transactions

Supply & Demand

3Q23

7,244 Units

QUARTERLY DEMAND
YTD: 12,866

8,170 Units

QUARTERLY COMPLETIONS
YTD: 21,291

Annual Demand vs Completions

2018
23,385
24,316
2019
25,821
25,109
2024
20,124
26,215
2021
49,883
28,053
2022
-7,572
20,900
2023 YTD
12,866
21,291
  • Planned
    Completions
  • Pre-Planned
    Demand

Demand Trends

  • Despite recent fluctuations, D/FW regained demand momentum largely due to employment growth and increased migration. In the year-ending Q3 2023, 8,742 units were absorbed, outperforming 2022’s net move-outs, yet falling short of the pre-COVID five-year annual average of over 21,000 units.


  • Among the 48 Metroplex submarkets, demand has generally matched new supply, notably in leading submarkets such as Frisco, North Fort Worth/Keller, Allen/McKinney, and Burleson/Johnson County.

Completion Trends

  • In the year-ending 3rd quarter 2023, metro-wide, the inventory expanded by 25,386 units, roughly matching the average annual addition seen over the past five years.


  • Specifically, the Dallas-Plano-Irving metro division accounted for 67% of the Metroplex deliveries in the last four quarters, representing 17,057 units.

Demand Outlook

  • The upcoming four quarters present a positive outlook for demand in the Dallas Metroplex, with an anticipated absorption of 52,797 units which would outpace the estimated 49,046 units projected to come online during the same period.


  • The Allen/McKinney and Frisco submarkets are poised to emerge as significant demand centers, with their projected annual absorption rates reaching 6,570 and 5,847 units, respectively.

New Supply Outlook

  • The upcoming four quarters mark a peak period for new apartment delivery in the Dallas Metroplex, with an anticipated 49,046 units slated to come online during this timeframe.


  • The Allen/McKinney and Frisco submarkets are set to significantly bolster the new housing supply, with projections to add 6,837 and 6,209 units, respectively, over the next four quarters.

Occupancy & Rent Trends

RENT VS OWN
MONTHLY PAYMENT

$3,020

Average Monthly Mortgage Payment

$1,552

Average Monthly Rent

Occupancy trends

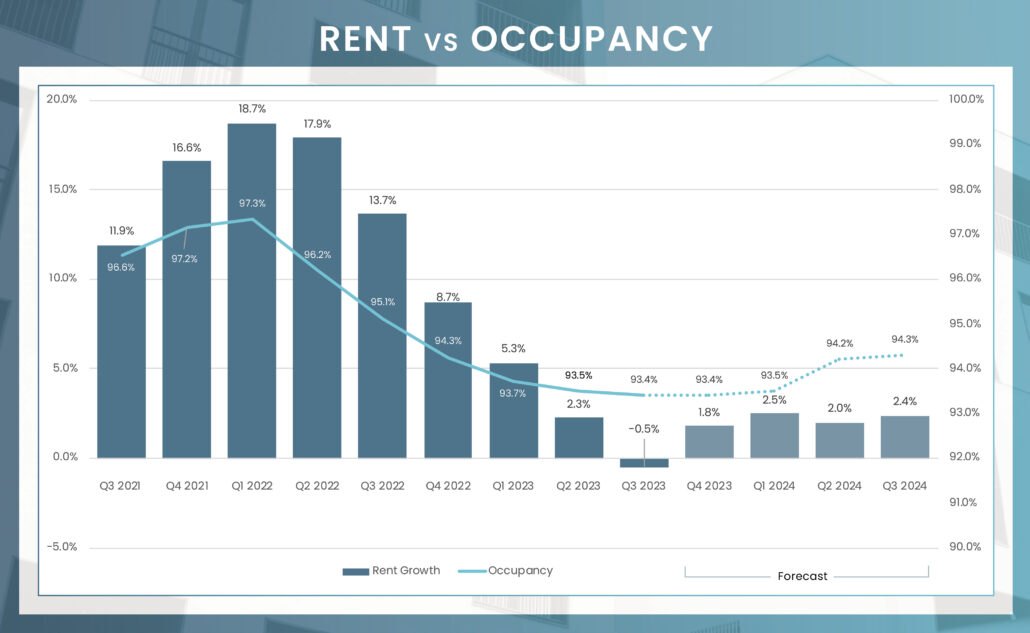
Occupancy rates in the Dallas/Fort Worth market observed a modest downturn in the 3rd quarter, settling at 93.4%, a decline of 1.6 percentage points from the previous year. This positioning, while on the lower spectrum among the nation’s top 150 markets, still hovers near the long-term average occupancy rate of around 94%. The 3rd quarter of 2023 saw the lion’s share of submarkets with occupancy rates falling below the 94% mark, the exceptions being predominantly in the less bustling suburban or outer urban submarkets. Dissecting occupancy by asset type reveals Class A properties at the helm with 93.8%, succeeded by Class B at 93.3%, and Class C, the more affordable segment, registering at 92.9%.

RENTAL TRENDS

In the year-ending 3rd quarter 2023, the Dallas Metroplex saw a modest decline in new lease rents, registering a 0.5% decrease. This rate of change was consistent across both Dallas and Fort Worth metro divisions. Within the market, Class A effective rents experienced a slight dip of 0.1%, while Class B rents fell by 1.0%. Conversely, Class C properties managed a marginal increase of 0.3% in rents, despite occupancy dropping below 93%. Over half of the 48 submarkets in Metroplex observed mild to moderate rent reductions over the year, with the most robust rent growth recorded in outer urban submarkets.

Submarket Rent & Occupancy

SubmarketAverage OccupancyAnnual Occupancy ChangeAverage Monthly RentAnnual Rent Change
Addison/Bent Tree93.8%-1.6%$1,583-0.9%
Allen/McKinney93.7%-1.6%$1,673-2.7%
Burleson/Johnson County93.4%-3.2%$1,449-0.5%
Carrollton/Farmers Branch94.6%-1.2%$1,6090.5%
Central Arlington92.4%-2.0%$1,2860.8%
Central/East Plano93.5%-2.0%$1,633-2.7%
Denton93.6%-1.9%$1,4251.4%
East Dallas94.0%-1.1%$1,8892.3%
East Fort Worth89.9%-3.9%$1,1400.5%
Ellis County93.6%-2.1%$1,4844.8%
Far East Dallas93.2%-1.1%$1,2251.2%
Far North Dallas92.7%-2.5%$1,366-2.9%
Frisco94.0%-1.3%$1,800-2.2%
Garland93.3%-2.0%$1,4122.0%
Grand Prairie93.6%-1.4%$1,491-0.8%
Grapevine/Southlake94.7%-0.4%$1,735-0.6%
Haltom City/Meacham93.1%-1.3%$1,360-0.3%
Hunt County95.7%-1.0%$1,0796.2%
Hurst/Euless/Bedford93.4%-1.6%$1,431-0.1%
Intown Dallas93.5%-1.1%$2,143-1.3%
Intown Fort Worth/University93.6%-0.5%$1,620-1.7%
Kaufman County93.1%-3.7%$1,4440.1%
Las Colinas/Coppell93.6%-1.7%$1,777-1.1%
Lewisville/Flower Mound94.1%-0.9%$1,582-1.4%
Love Field/Medical District93.5%-1.2%$1,574-1.7%
Mesquite93.3%-1.5%$1,2583.0%
North Arlington92.3%-1.1%$1,3190.8%
North Dallas92.9%-2.5%$1,4590.3%
North Fort Worth/Keller93.2%-2.1%$1,626-2.3%
North Irving92.9%-2.9%$1,4241.0%
North Oak Cliff/West Dallas93.3%-1.5%$1,5520.1%
Northeast Dallas92.2%-1.9%$1,219-1.0%
Northeast Fort Worth/North Richland Hills93.0%-2.2%$1,453-3.0%
Northwest Dallas94.0%-2.7%$1,2577.0%
Oak Lawn/Park Cities93.5%-1.3%$2,363-1.1%
Richardson94.0%-1.5%$1,715-1.8%
Rockwall/Rowlett/Wylie91.4%-2.1%$1,642-1.8%
South Arlington/Mansfield93.0%-1.9%$1,531-0.5%
South Fort Worth93.2%-2.3%$1,1990.9%
South Irving93.9%-2.0%$1,3132.3%
Southeast Dallas94.6%-0.7%$1,1729.3%
Southern Dallas County92.1%-2.9%$1,371-0.1%
Southwest Dallas91.4%-2.4%$1,1894.1%
Southwest Fort Worth92.7%-1.3%$1,2851.5%
The Colony/Far North Carrollton93.9%-1.6%$1,750-0.2%
West Fort Worth/Parker County93.3%-1.6%$1,336-1.8%
West Plano94.0%-0.8%$1,803-2.6%
Zang Triangle/Cedars/Fair Park94.5%-0.8%$1,475-0.8%
Dallas Metroplex93.4%-1.6%$1,552-0.5%

Units by Submarket Delivering in 2023

72,250

Number of Units Under Construction

49,046

Number of Units UC Delivering In the Next 4 Quarters

Units Under Construction

Addison/Bent Tree - 730
0%
Allen/McKinney - 10,987
0%
Burleson/Johnson County - 1,506
0%
Carrollton/Farmers Branch - 964
0%
Central Arlington - 651
0%
Central/East Plano - 1,922
0%
Denton - 4,298
0%
East Dallas - 1,086
0%
East Fort Worth - 0
0%
Ellis County - 1,538
0%
Far East Dallas - 56
0%
Far North Dallas - 897
0%
Frisco - 8,222
0%
Garland - 1,726
0%
Grand Prairie - 3,390
0%
Grapevine/Southlake - 0
0%
Haltom City/Meacham - 730
0%
Hunt County - 152
0%
Hurst/Euless/Bedford - 395
0%
Intown Dallas - 3,7285
0%
Intown Fort Worth/University - 2,089
0%
Kaufman County - 1,601
0%
Las Colinas/Coppell - 1,914
0%
Lewisville/Flower Mound - 2,357
0%
Love Field/Medical District - 1,253
0%
Mesquite - 0
0%
North Arlington - 324
0%
North Dallas - 571
0%
North Fort Worth/Keller - 1,705
0%
North Irving - 0
0%
North Oak Cliff/West Dallas - 1,408
0%
Northeast Dallas - 893
0%
Northeast Fort Worth/North Richland Hills - 678
0%
Northwest Dallas - 0
0%
Oak Lawn/Park Cities - 937
0%
Richardson - 1,095
0%
Rockwall/Rowlett/Wylie - 2,609
0%
South Arlington/Mansfield - 570
0%
South Fort Worth - 3,092
0%
South Irving - 0
0%
Southeast Dallas - 0
0%
Southern Dallas County - 65
0%
Southwest Dallas - 866
0%
Southwest Fort Worth - 0
0%
The Colony/Far North Carrollton - 1,772
0%
West Fort Worth/Parker County - 2,633
0%
West Plano - 0
0%
Zang Triangle/Cedars/Fair Park - 840
0%

Units Delivering Next 4Q

Addison/Bent Tree - 512
0%
Allen/McKinney - 5,523
0%
Carrollton/Farmers Branch - 727
0%
Central/East Plano - 1,385
0%
Denton - 2,455
0%
East Dallas - 568
0%
SubmarketUnits Under Construction% of Total UCUnits UC Delivering In the Next 4 Quarters% of Total UC Delivering Next 4Q
Addison/Bent Tree7301%4401%
Allen/McKinney10,98715%6,83714%
Burleson/Johnson County1,5062%9012%
Carrollton/Farmers Branch9641%5281%
Central Arlington6511%6511%
Central/East Plano1,9223%1,3153%
Denton4,2986%2,7366%
East Dallas1,0862%6161%
East Fort Worth00%00%
Ellis County1,5382%1,2753%
Far East Dallas560%560%
Far North Dallas8971%8012%
Frisco8,22211%6,20913%
Garland1,7262%6341%
Grand Prairie3,3905%2,6265%
Grapevine/Southlake00%00%
Haltom City/Meacham7301%6391%
Hunt County1520%1520%
Hurst/Euless/Bedford3951%590%
Intown Dallas3,7285%2,3035%
Intown Fort Worth/University2,0893%1,8274%
Kaufman County1,6012%8192%
Las Colinas/Coppell1,9143%1,1792%
Lewisville/Flower Mound2,3573%2,0384%
Love Field/Medical District1,2532%7822%
Mesquite00%00%
North Arlington3240%240%
North Dallas5711%1710%
North Fort Worth/Keller1,7052%1,4193%
North Irving00%00%
North Oak Cliff/West Dallas1,4082%1,3243%
Northeast Dallas8931%8932%
Northeast Fort Worth/North Richland Hills6781%6781%
Northwest Dallas00%00%
Oak Lawn/Park Cities9371%1520%
Richardson1,0952%7111%
Rockwall/Rowlett/Wylie2,6094%2,0064%
South Arlington/Mansfield5701%5331%
South Fort Worth3,0924%1,3443%
South Irving00%00%
Southeast Dallas00%00%
Southern Dallas County650%650%
Southwest Dallas8661%8662%
Southwest Fort Worth00%00%
The Colony/Far North Carrollton1,7722%7692%
West Fort Worth/Parker County2,6334%1,9124%
West Plano00%00%
Zang Triangle/Cedars/Fair Park8401%7562%
Dallas Metroplex72,250100%49,046100%

Sales Activity

Navigating through to the latter part of 2023, the Dallas market maintained a consistent pace in transaction activities, with around $3.1 billion being exchanged for 88 properties since the onset of the year, according to Real Capital Analytics. Although this figure indicates a 64.6% dip relative to the same timeframe last year, Dallas holds firm as one of the premier markets nationwide in cumulative sales volume. The average price per unit registered at $188,800, reflecting a 4.4% contraction compared to the preceding year. The compelling economic and demographic dynamics, together with low entry barriers and robust multifamily fundamentals, have continually attracted investors to the Dallas Metroplex. As a result, the metroplex has witnessed unprecedented capital investments over the past decade. This trend is expected to sustain, drawing investor interest even amidst the challenging market conditions currently at play.

  1. Weidner Apt Homes
  2. Knightvest Capital
  3. Tides Equities
  4. HF Investment Inc
  5. Post Investment Group
  1. Provident Realty Advisors
  2. Cortland
  3. Conti Capital
  4. JPI Multifamily
  5. SPI Advisory

*Most Active Buyers and Sellers are based on the sale volume of apartment units.

TRANSACTION VOLUME


YTD Transaction Volume


Y-O-Y Change


Individual Transaction Count


Price Per Unit


Annual Price Change

* Transaction data is for the whole Metroplex

* Trailing 4Q average PPU

* Preliminary Data from RCA – Individual conventional MF transaction $2.5M +

Economy

In the third quarter of 2023, the Dallas metropolitan region witnessed significant economic advancements, marked by a 2.5% surge in its Gross Domestic Product (GDP). This development was paralleled by a net addition of 178,600 jobs, illustrating a 4.4% escalation in employment. As of July, the unemployment rate was pegged at 3.8%, marginally exceeding the national average, also 3.8%. The professional and business services sector spearheaded job additions, introducing 39,100 positions, which signifies a 5.1% growth. Additionally, the trade, transportation, and utilities sector observed a commendable upswing by adding 23,200 jobs, equivalent to a 2.6% annual increase. Despite initial job deficits induced by the pandemic, the current employment base now comfortably exceeds pre-pandemic levels from February 2024 by approximately 339,600 jobs, or about 12%. The metro area of Dallas, hosting the headquarters of 22 Fortune 500 companies, fortifies its growing corporate foundation, with a significant presence in the Dallas central business district, the Dallas North Tollway corridor, and the Las Colinas area.

178.6K

July Annual Jobs Created

4.4%

July 23 Employment growth

4.1%

July 23 Unemployment rate
3.8% us July rate

Top 5 Employment Sector Annual Change

Business & professional services

Business & professional services

Change from July 2022 to July 2023:
39,100

Percent Change:
5.1%

Trade, Transportation & Utilities

TRADE, TRANSPORTATION & UTILITIES

Change from July 2022 to July 2023:
23,200

Percent Change:
2.6%

Mining, Logging & Construction

MINING, LOGGING & CONSTRUCTION

Change from July 2022 to July 2023:
22,300

Percent Change: 9.5%

EDUCATION & HEALTH SERVICES

EDUCATION & HEALTH SERVICES

Change from July 2022 to July 2023:
19,600

Percent Change:
4.1%

FINANCIAL SERVICES

FINANCIAL SERVICES

Change from July 2022 to July 2023:
18,800

Percent Change:
5.2%

Hover over icons to view data
SectorChange from July 2022 to July 2023 Percent Change
Professional and business services39,100 5.1%
Trade, transportation, and utilities23,200 2.6%
Mining, logging, and construction22,300 9.5%
Education and health services19,600 4.1%
Financial activities18,800 5.2%
Government14,000 3.2%
Leisure and hospitality13,400 3.3%
Other services13,200 10.1%
Manufacturing10,600 3.5%
Information4,400 4.8%

Cost of Living Comparison

The cost of living in the Dallas Metroplex, with an index score of 102.9, slightly surpasses the national average, yet the housing market remains more affordable with a housing index of 98.1 and a median home sales price of $398,800. When compared to Los Angeles-Long Beach, CA, Dallas boasts significantly lower costs in key areas—housing is 59.5% less expensive, and transportation costs are 30.3% lower, making it a financially appealing location for many individuals.

Los Angeles, CA vs. Dallas, TX
Cost of Living Comparison
Groceries:

11.2% Less
Housing:

59.5% Less
Utilities:

1.7% More
Transportation:

30.3% Less
Health:

0.7% More
Cost of Living Index

102.9

Index Score

Average Mortgage

$3,020

vs Average Rent: $1,552

Housing

106.3

Index Score

Utilities

111.1

Index Score

Gas

89.6

Index Score

Median Home Sales Price

$398,800

YoY Change: -4.5%

The “Cost of Living” index score provides a comparative assessment of the relative expense involved in maintaining a standard of living in a specific area, benchmarked against a national index score of 100.

Source: COLI; BLS; Consumer Price Index for All Urban Consumers (CPI-U): Selected areas, all items index, July 2023

Market Outlook

Leading the nation in new apartment supply, the Metroplex saw the completion of 25,386 units in the year-ending 3rd quarter of 2023. Despite this influx, strong job growth and in-migration have fostered demand and economic recovery, lending stability to the market amidst prevailing economic uncertainties. New properties in lease-up have fared relatively well, particularly in the northern suburbs. Moving forward, the Metroplex apartment market is expected to rely on its solid underlying demand drivers to uphold market fundamentals. Nonetheless, the inflow of new supply may pose short-term challenges to market performance. The next 12 months are projected to see a surge in deliveries beyond recent peak levels, with 49,046 units earmarked for completion by the year-ending 3rd quarter of 2024.

Sources:RealPage; BLS; MSCI; The Council for Community And Economic Research (C2ER)

To Gain Further Insights Into The Dallas Market Please Reach Out To Our local Team

Image of Mike Watson

Mike Watson

Managing Director

Michael Moffit

Managing Director

Picture of Sanders Campbell

Sanders Campbell

Senior Advisor

Nicholas Ling

Senior Director

Image of Nathan

Nathan Allison

Associate

Have a question?
Send us a message!